Chapter 3 Technical Documentation
3.1 Cheatsheets
3.2 Field User General Manual
3.2.1 Create an Account or Team
Follow the instructions below to create an account or team in the Sim UI. All non-Administrator users need to self-register to join teams. Once the registration form is completed, a notice will be sent to MTL for approval. Once approved, the user will be notified by email they now have access to the dashboard.
Tip: Save and refer to this one-page Sim UI Cheatsheet when creating an account or team!
- There are two ways to navigate to the registration form:
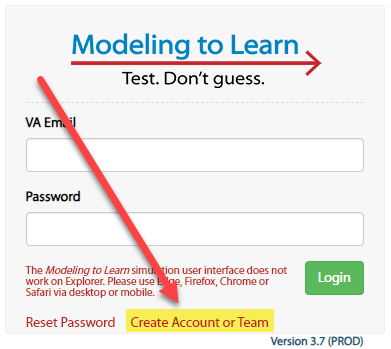
- Click on Create Account or Team in the Sim login window located at mtl.how/sim:
- Navigate to mtl.how/register in your Edge, Firefox, or Chrome browser.
- Complete the form as shown below:
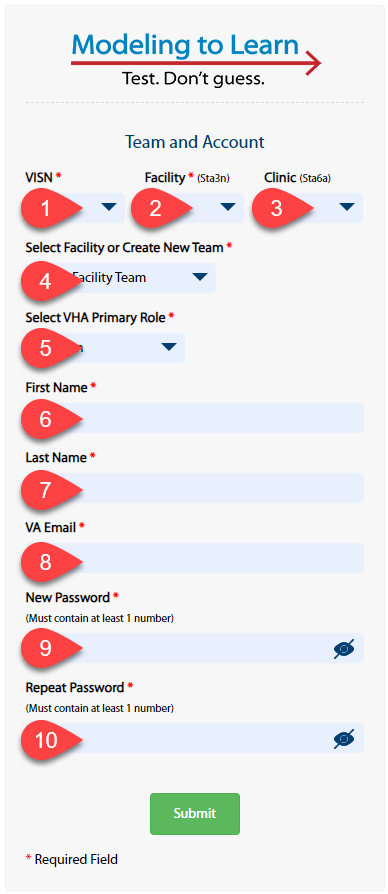
1 - VISN: Select your VISN from the dropdown menu.
2 - Facility: Select your facility from the dropdown menu.
3 - Clinic: Select your clinic from the dropdown menu. This field is not required.
4 - Select Facility or Create New Team: If you are a team member: Select your existing team from the dropdown menu. If you are a team lead: Select Create New Team.
If you are creating a team or the first person to register from your Facility Team, the following pop-up window will appear (with your VISN, Facility, and Clinic pre-populated).
Enter your Facility Team name in the pop-up window (immediately after the pre-populated information).
Notes: You must only use lowercase letters. You must use the underscore character (_) instead of spaces.
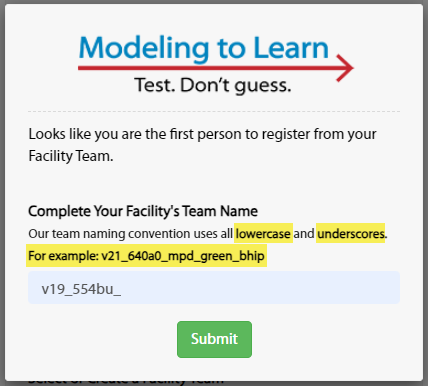
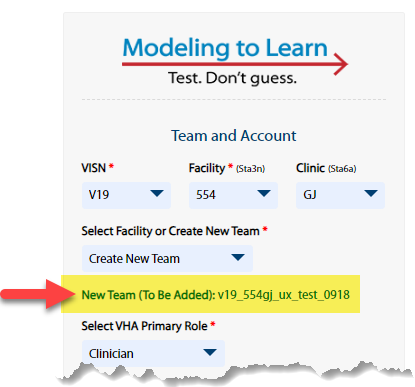
- Click the Submit button. Even though the dropdown field remains unchanged on the form, the submitted team name is saved, as confirmed by the green text as shown in this example:
5 - Select VHA Primary Role: Select your primary VHA role from the dropdown menu. Choices are: Clinician, Data Subject Matter Expert, Leader/Manager, Quality Improvement, Researcher/Evaluator, Systems Modeler, and Other.
6 - First Name: Enter your first name.
7 - Last Name: Enter your last name.
8 - VA Email: Enter your VA email.
9 - New Password: Create a password and enter it here. Tip: Write it down so you don’t forget!
Note: Your password must contain at least 1 number.
10 - Repeat Password: Re-enter the password you just created. Tip: To check if both passwords match, click the eye with a slash icon in each field to reveal what you typed.
Click the green Submit button. The Registration Detail pop-up will appear.
Ensure the registration details displayed on the pop-up are accurate.
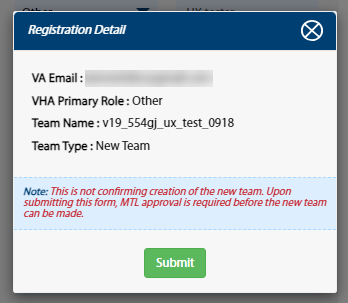
- If the information is not correct, close the pop-up window and make adjustements to the registration form where needed.
- If the information is correct, click the green Submit button.
A success page will appear:
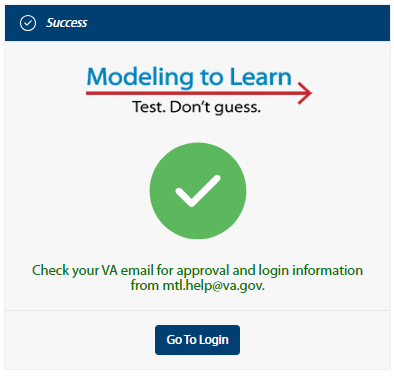
- After your registration request is reviewed and approved, an approval email will be sent to your VA address that contains login information for accessing the MTL Sim UI.
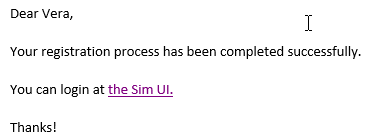
3.2.2 Log in to the Sim UI
You must already have an account set up to log into the Sim UI. If you do not have an account yet, follow the Create and Account or Team instructions and wait to receive an approval email.
- Navigate to mtl.how/sim, enter your credentials, and click the Login button.
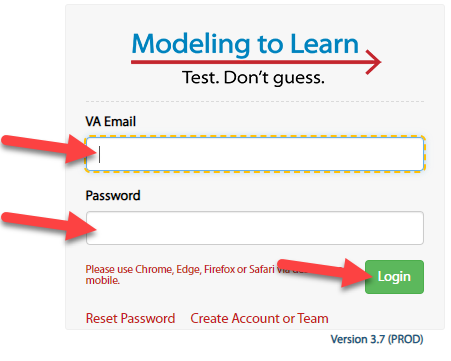
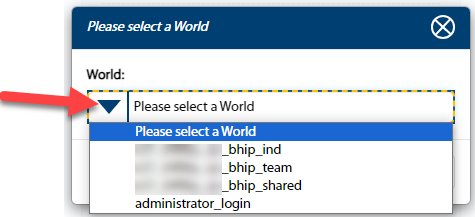
- A Please select a World pop-up will appear. The Sim will load teams and, once you select a team, you will be directed to that team’s Home page.
Notes:
- The login dropdown only shows worlds in which you are a team lead or participant (not an Administrator).
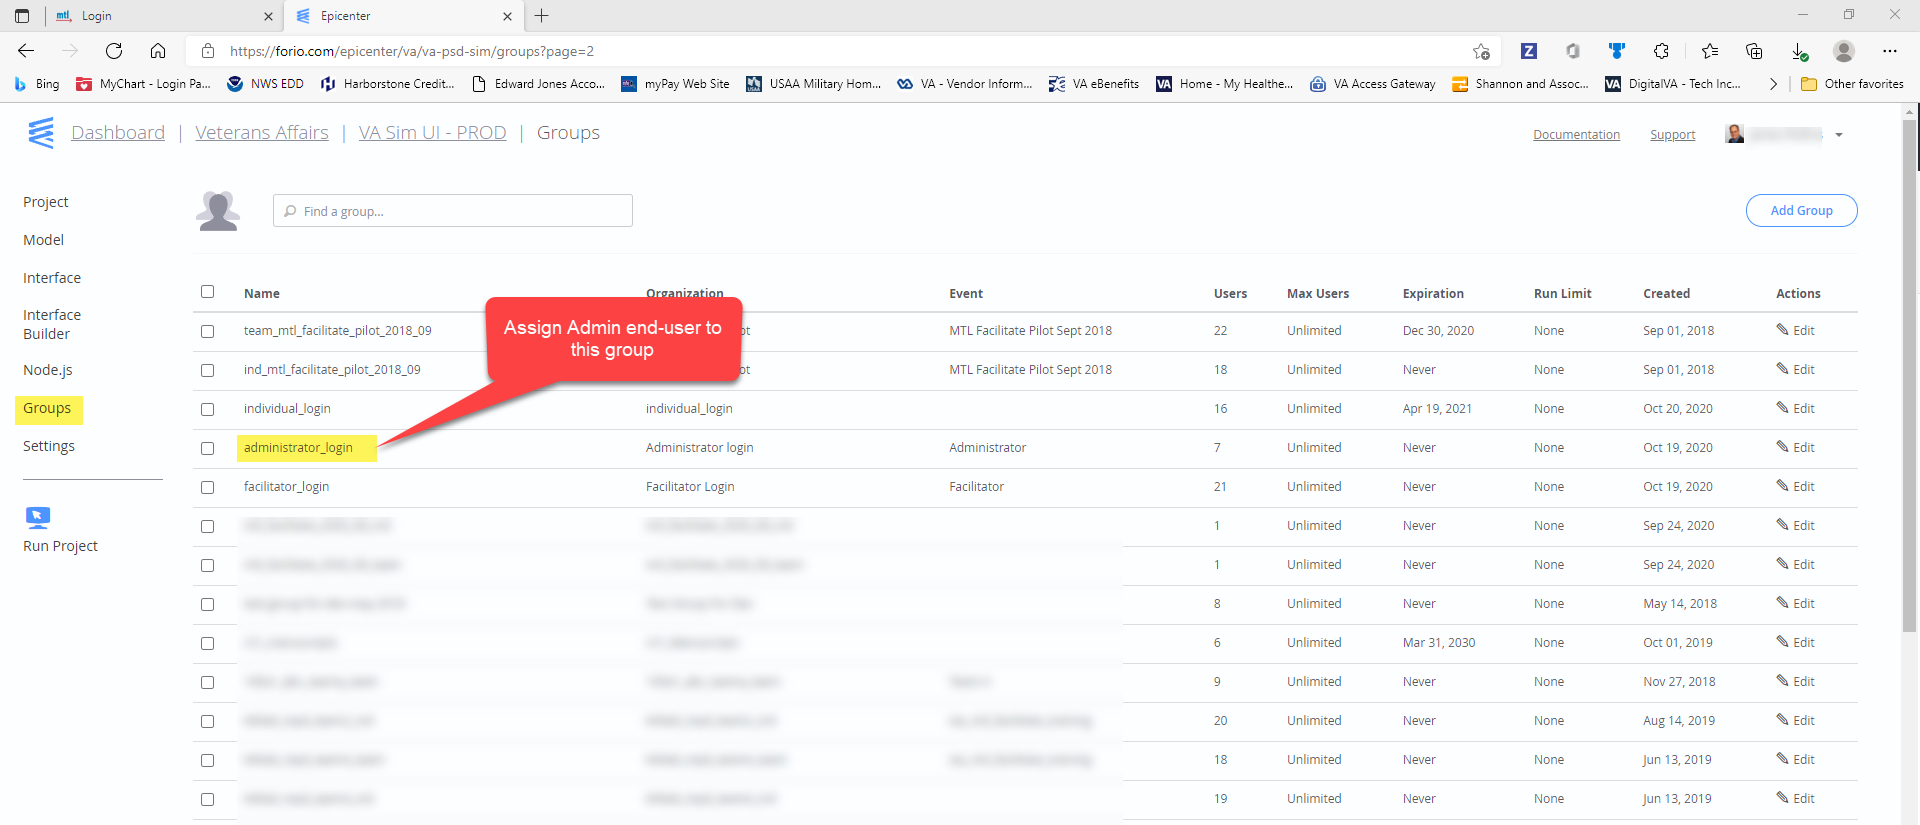
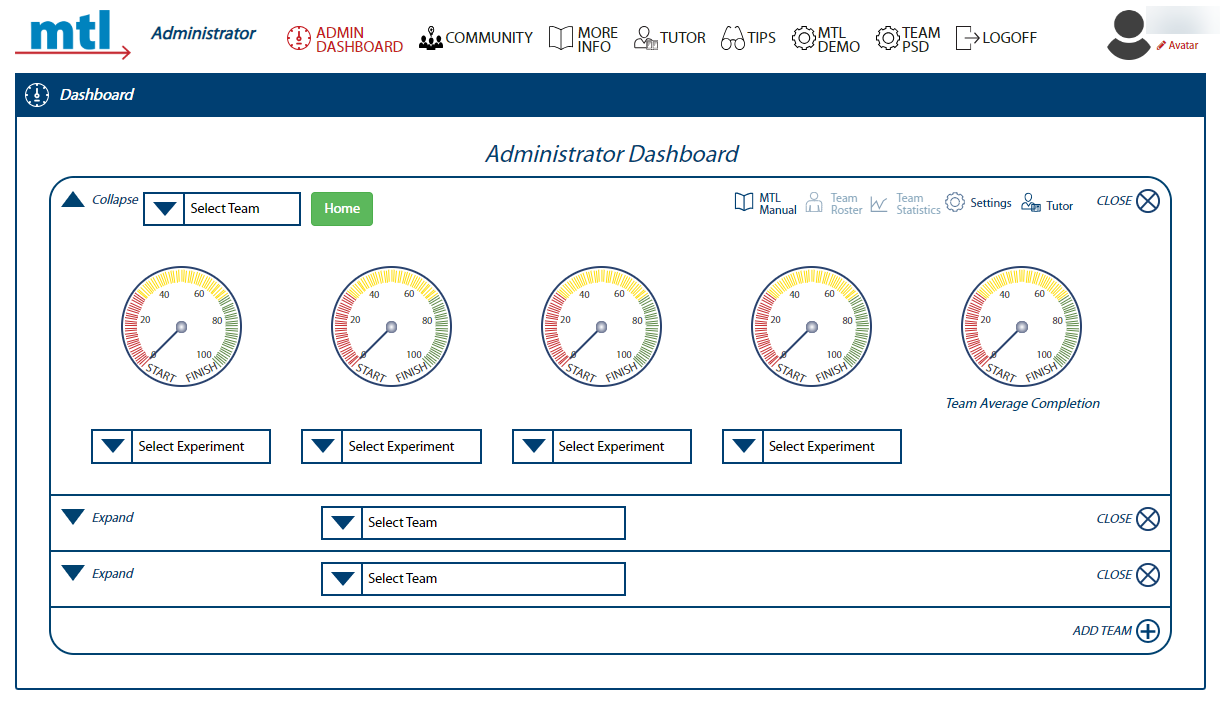
- If you have the Administrator role in any team and have been added into “administrator_login” in Epicenter, you will be allowed to login using the “administrator_login” choice. Upon logging in, Administrators are directed to the Administrator Dashboard.
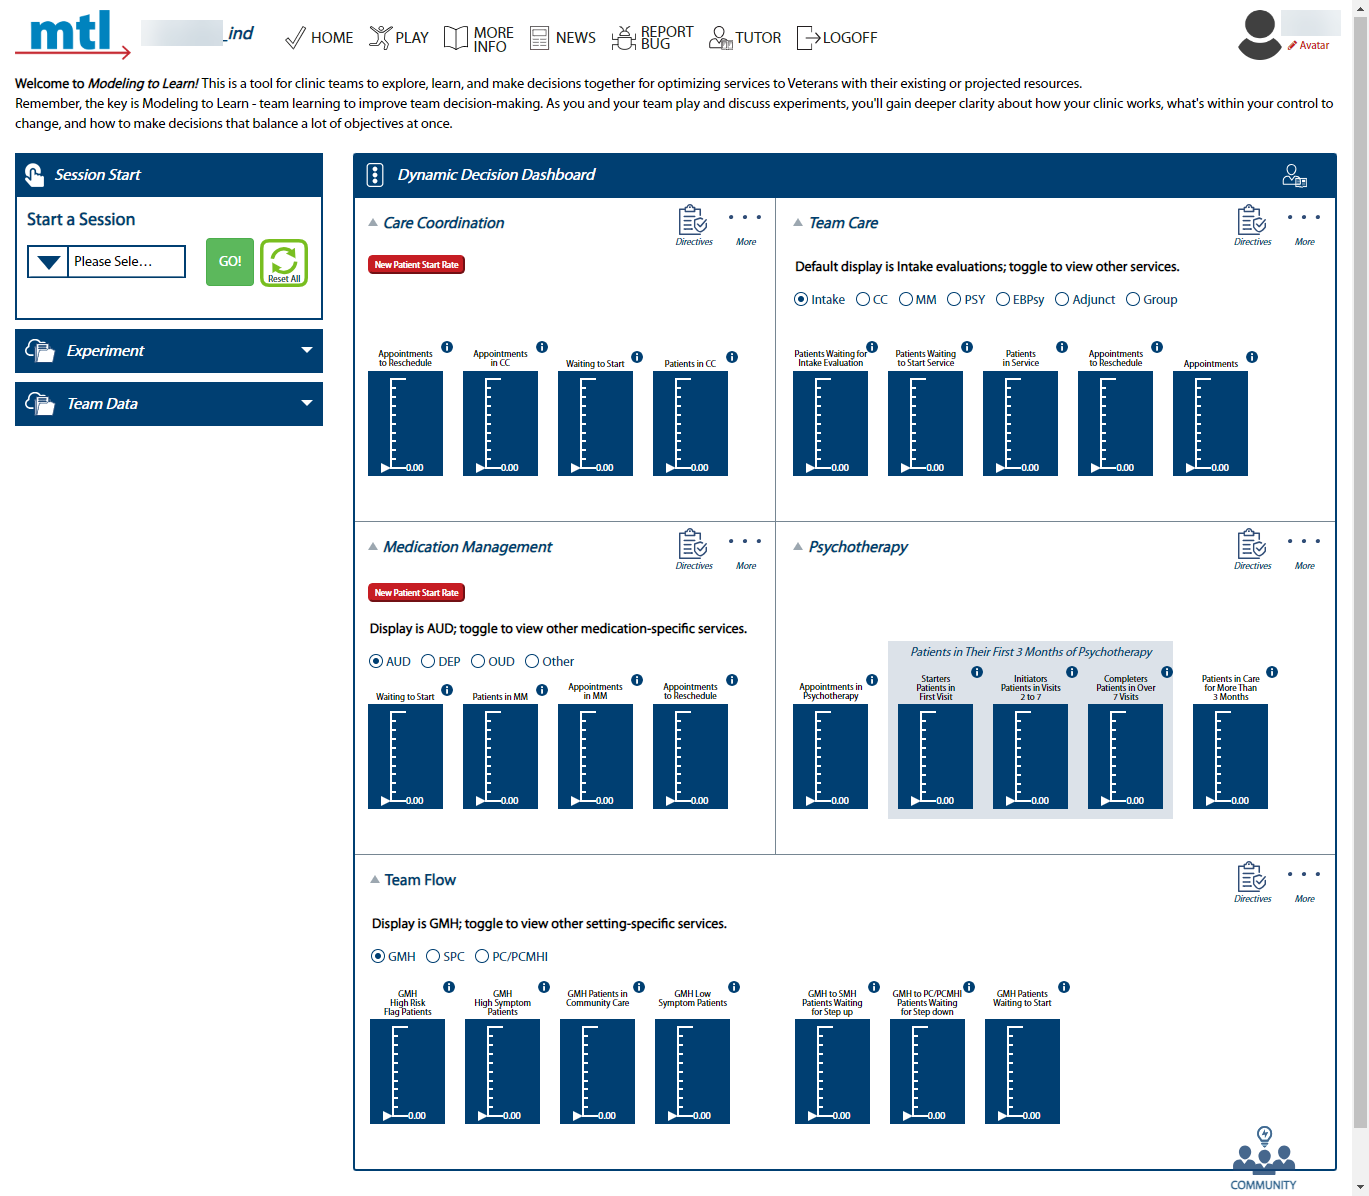
- The screenshots below display what you will see upon logging in, depending on your role.
Note: To familiarize yourself with a team’s Home page, refer to Orient to the Home Page
| Team Member login = team’s Home page | Administrator login = Admin Dashboard |
|---|---|
 |
 |
3.2.3 Make, View, and Export Team Clinic Selections for Import to Sim UI
Tip: Refer to (or save) the one-page Data Cheatsheet when using the Data UI and making clinic and flow selections.
The general workflow for the Data UI is that teams:
Select their clinics and team flow (if applicable).
Review and look at the data and viz tabs to observe trends in the clinics.
Generate the Data UI file from Power BI to export into the Sim UI.
Notes:
All users must follow certain naming conventions, which are explained below, when downloading Team Data files.
When a Team Data file is downloaded from the Data UI, it is in a specific format that the Sim UI reformats during upload. This means that if a Team Data file is downloaded from the Sim UI and then re-uploaded to the Sim UI it will not work!
Clinic selections and data tabs refresh every night.
Viz tabs update monthly at the beginning of the month.
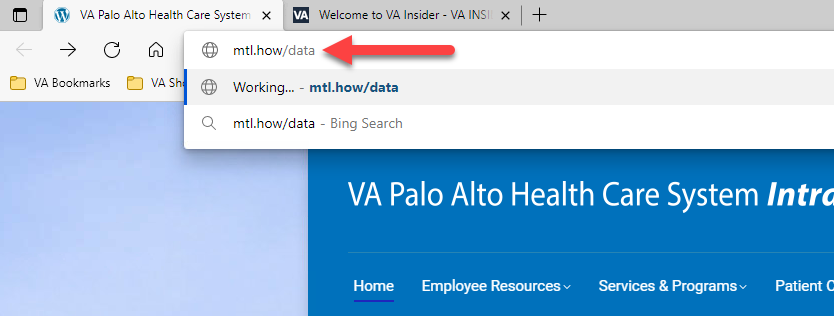
- Open Chrome, Edge, Safari, or Firefox browser and go to mtl.how/data.
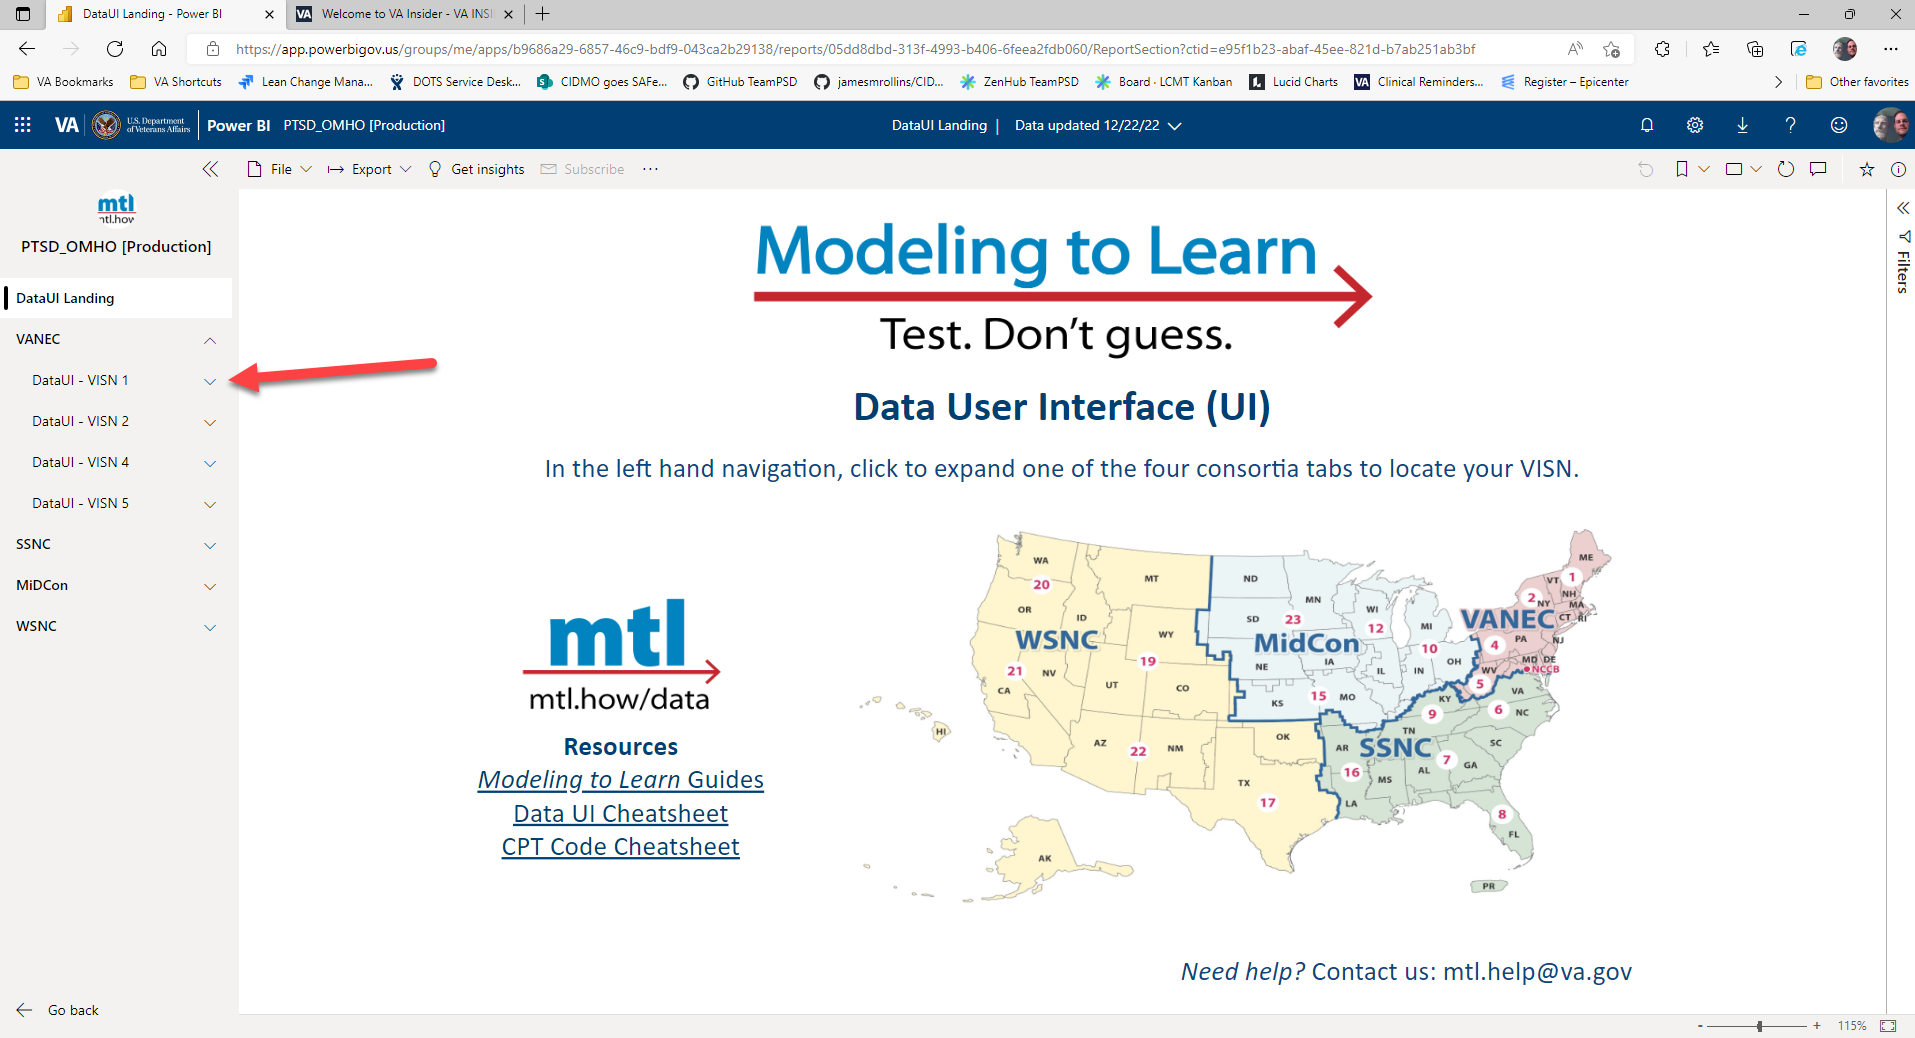
- Using the left-hand navigation pane, navigate to the desired Region and VISN.
- Click on the Clinic Selection tab and select and view your local team data.
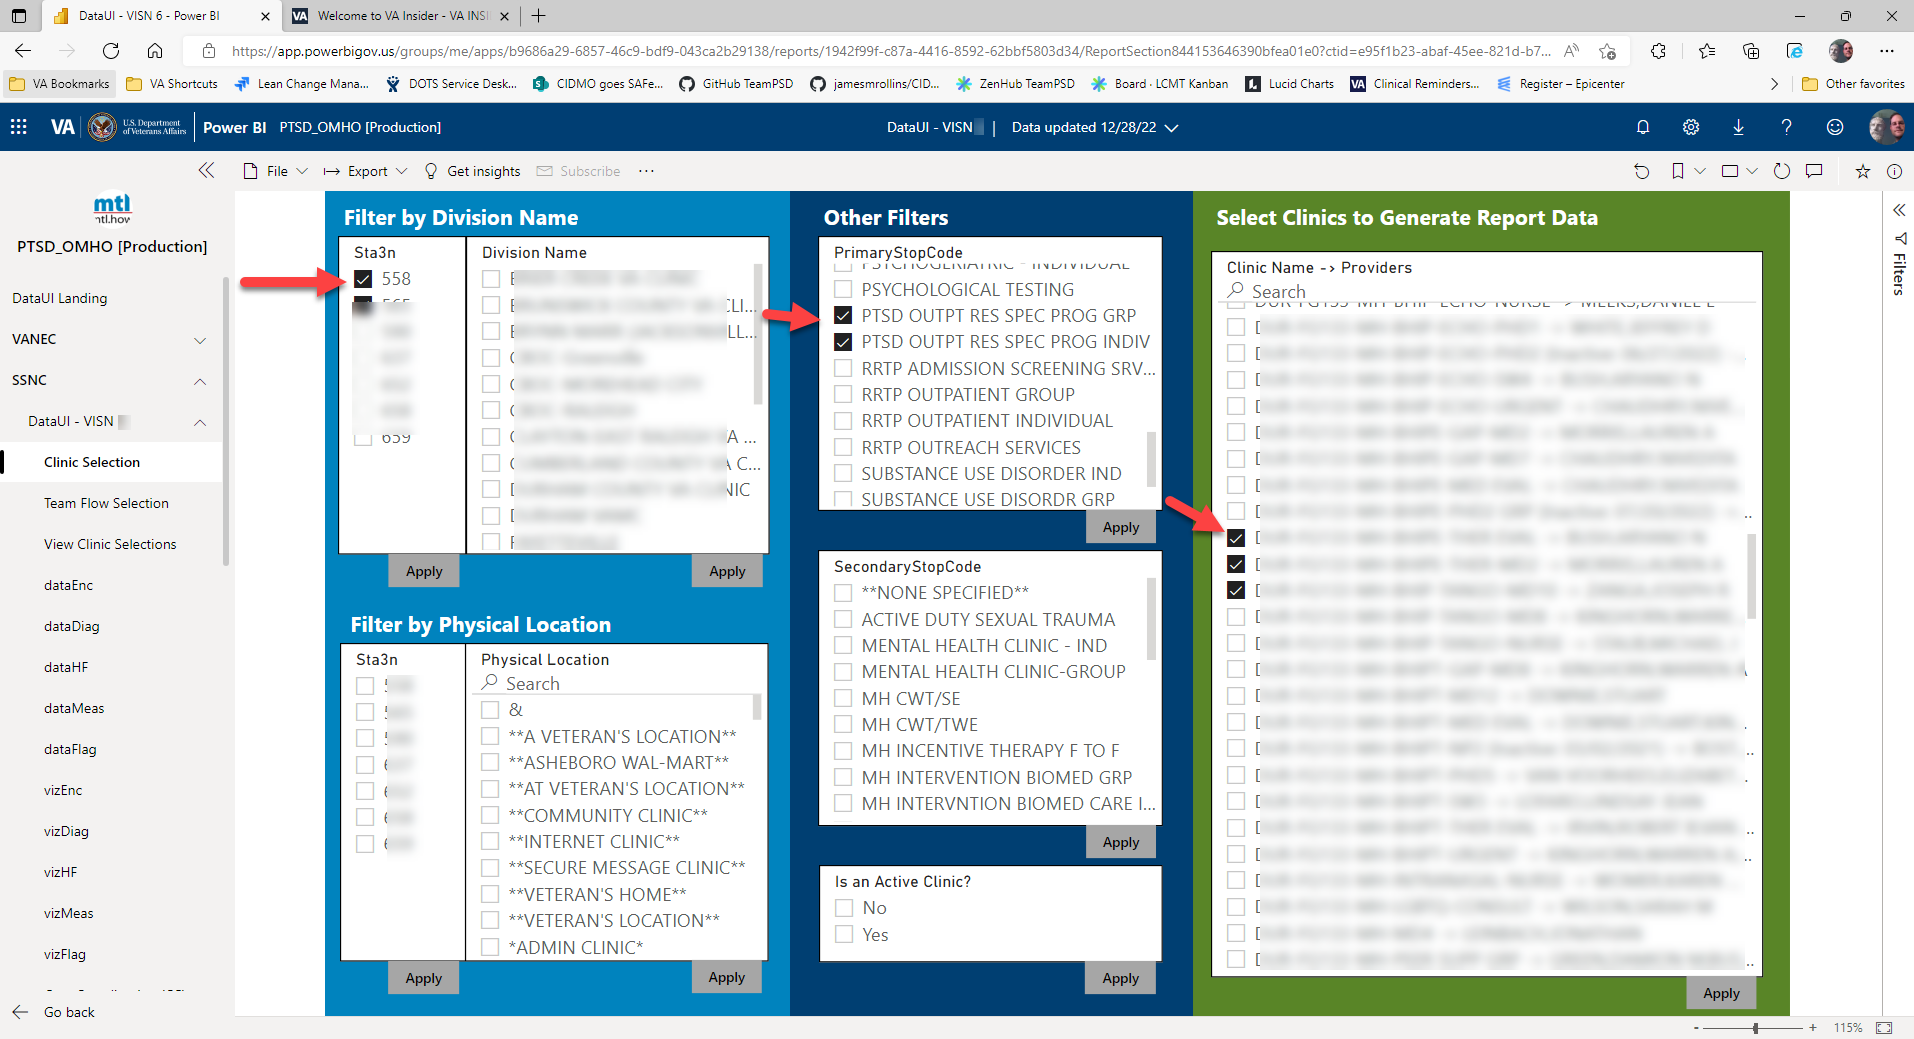
Filter by Division Name, Physical Location, PrimaryStopCode, SecondaryStopCode, and/or Is an Active Clinic? (de-activated clinics denoted by ZZ) in the left and middle columns.
Search and filter for your team’s clinics by clinic name or by provider in the Select Clinics to Generate Report Data column after making selections in the left and middle columns.
Click the green Apply button to pull Patient Level Data from all clinics selected in the last two years.
Select clinics that your team refers to in the Team Flow Selection tab to produce data tracking patients stepped up/down for the Team Flow module.
For example, if you are a GMH team, you would select SMH in the dropdown for “The clinics selected below that my team refers to are” and add the SMH clinics your team refers to in the Green column, second row.
In the bottom right-hand columns for the three possible care settings (GMH, SMH, PC/PCMHI) indicate the threshold for minimum gap in patient care required for subsequent visit to be considered a new care episode. In general, for the (GMH or SMH or PC/PCMHI) setting, how long of a gap in patient care is required for the subsequent visit to be considered a new care episode? Set the threshold below in months. The default threshold is 9 months (39 weeks).
Click Apply.
Notes:
Are the clinics and data not populating? Request and verify your local server views by following steps outlined in Request and Verify Local Server View Permissions.
If you wish to have quick access to these Clinic Selections in the future, you can make a personal bookmark to return to it. Go to the Bookmarks drop-down menu and click on Add a personal bookmark. In the bookmark name field, use Team PSD convention for the name: Sta3n_Division Name_Date (date in yyyy_mm_dd format), then select Save.
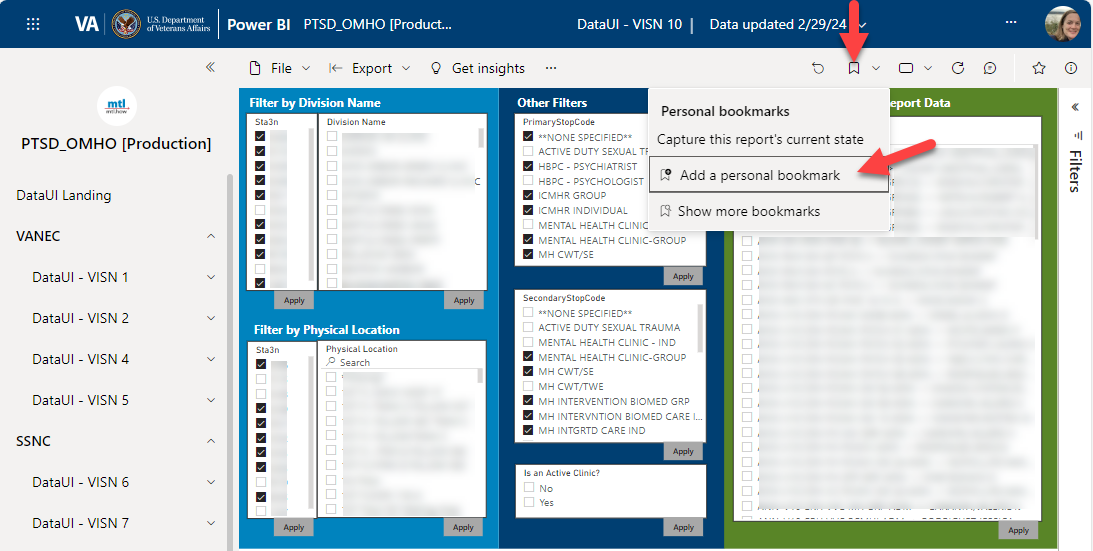
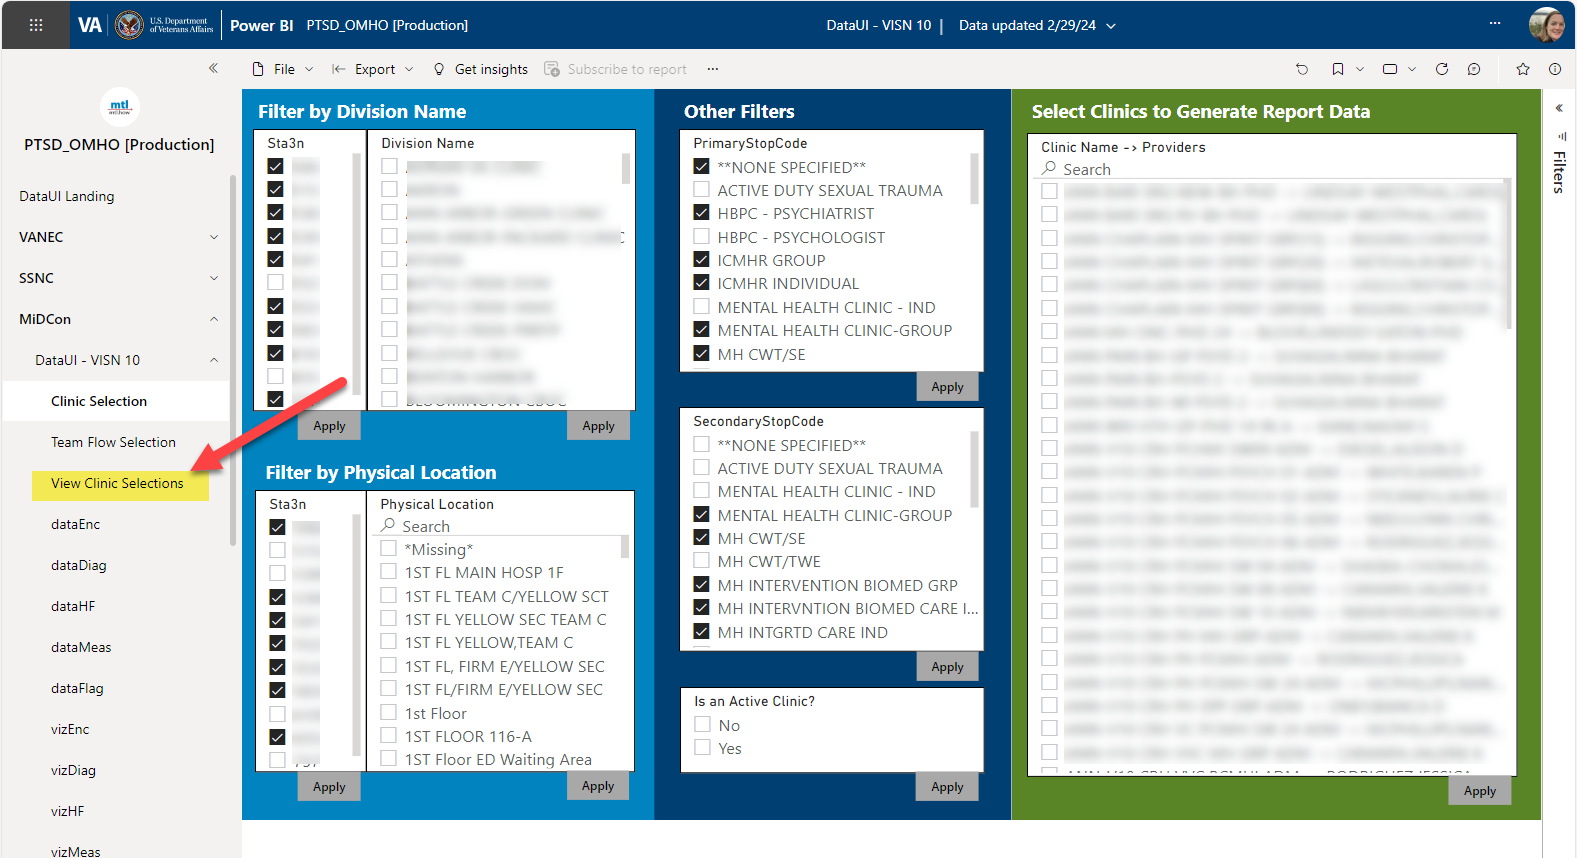
- Scroll until you see the View Clinic Selections tab on the left-hand side.
- Hover over the Clinic Name > Providers heading and click on the ellipsis that appears.
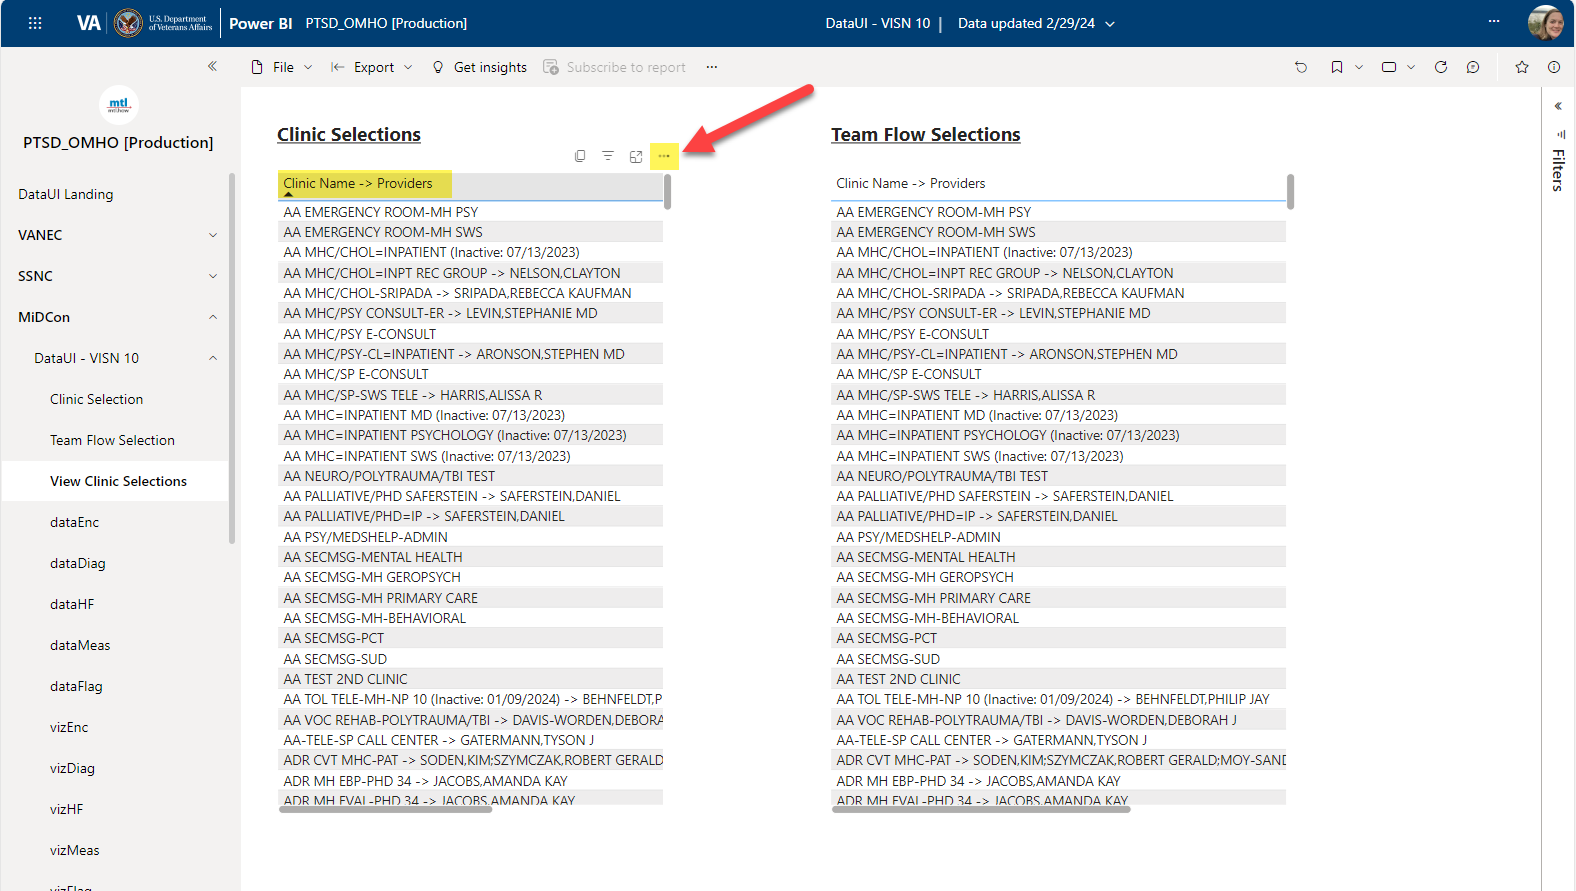
- Click Export data > Data with Current Layout > Export.
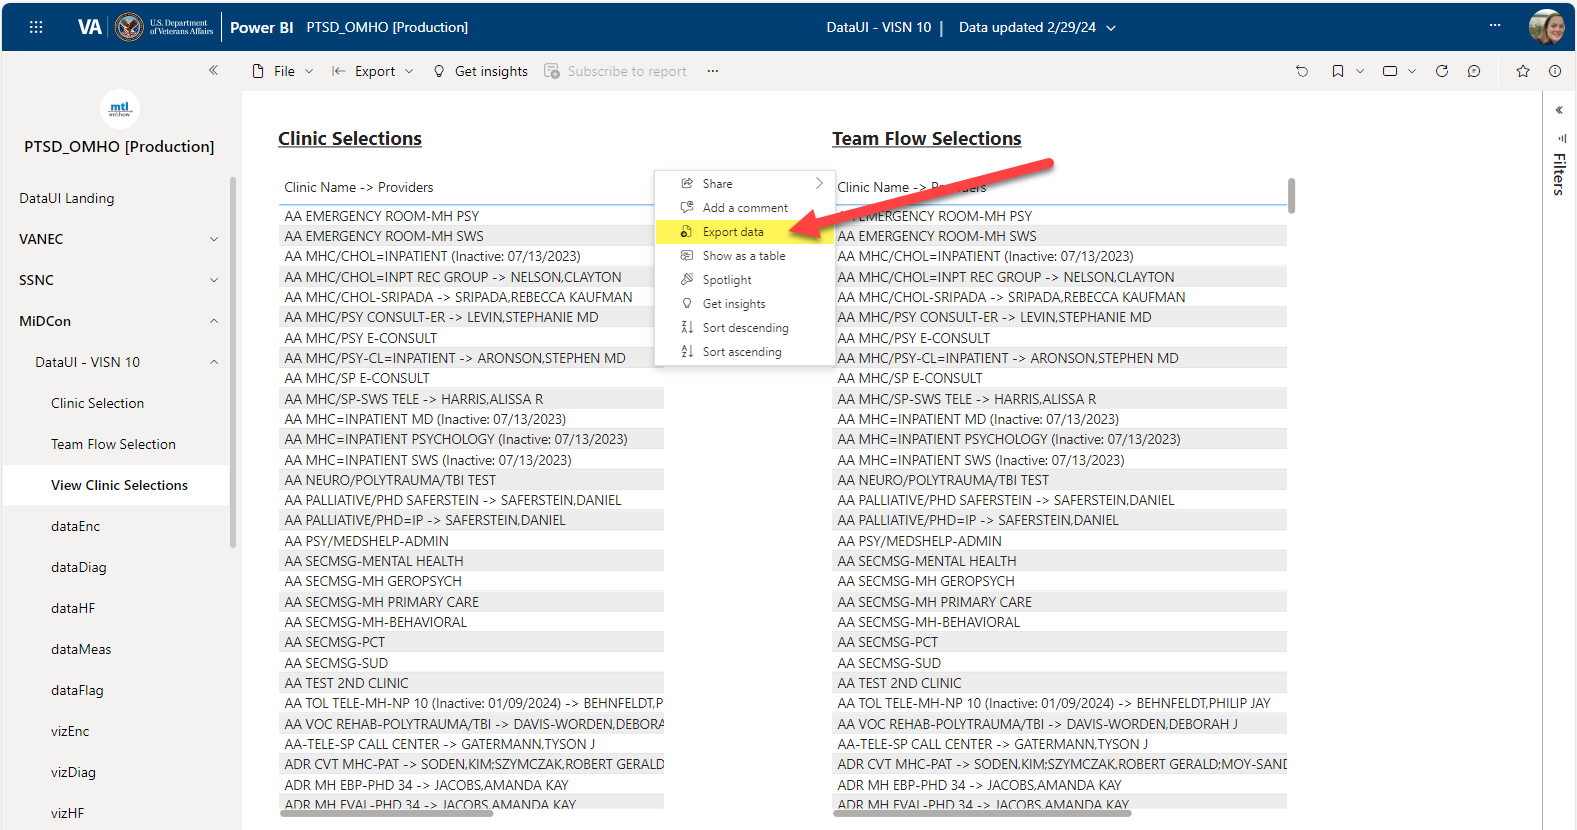
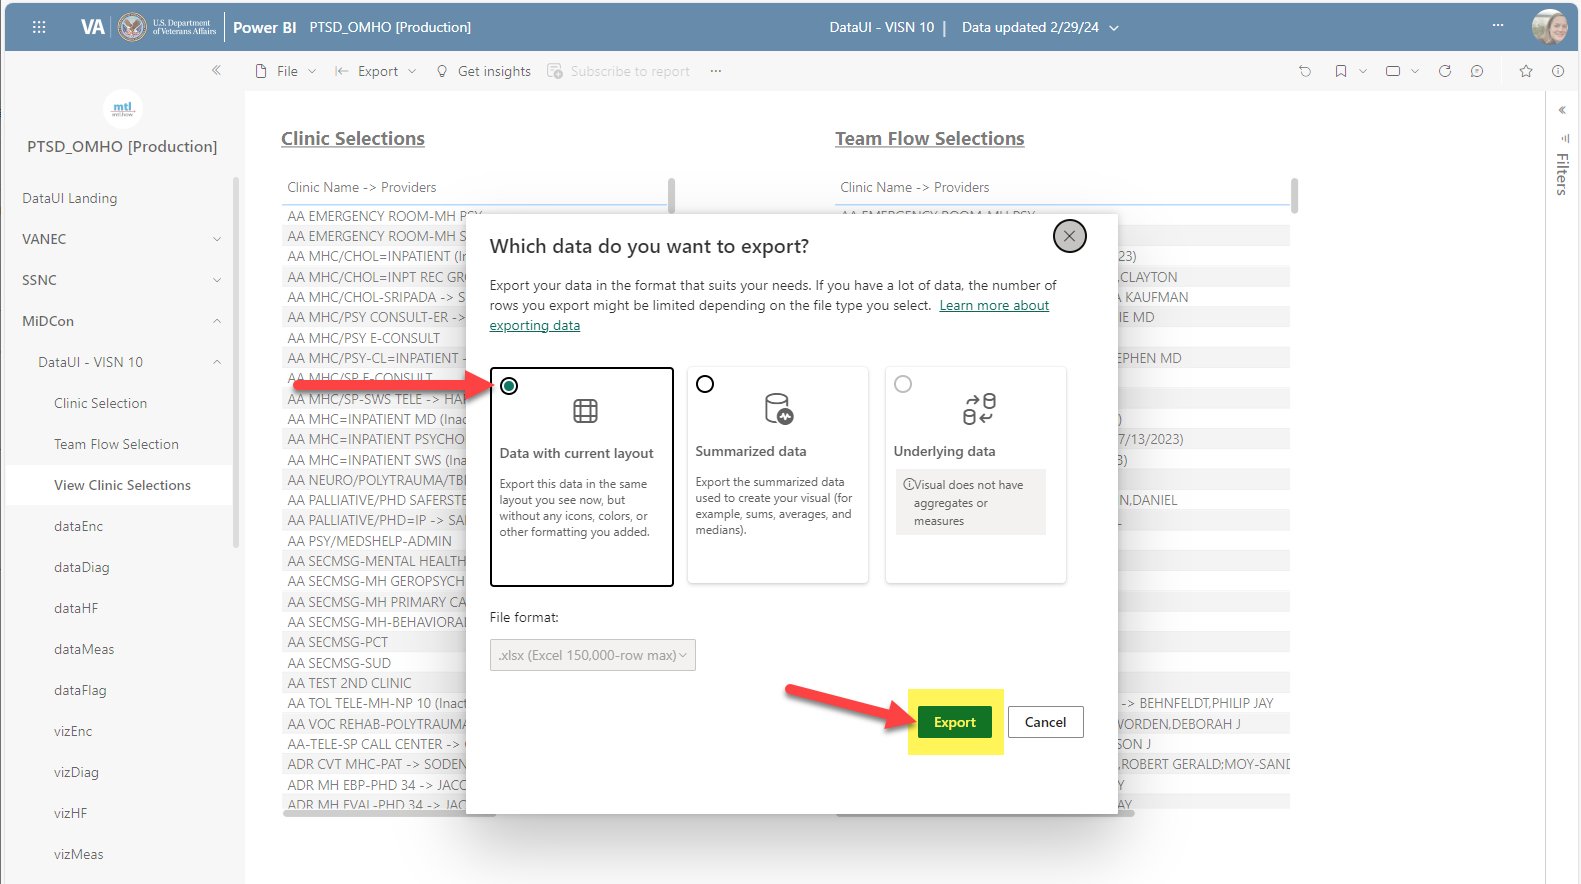
- The Team Data file is exported to your browser’s download location. Save using our Team naming convention “Sta3n_geo-location_clinic_year_month_day” and post the file on the shared Team channel for Team members to view and confirm selections.
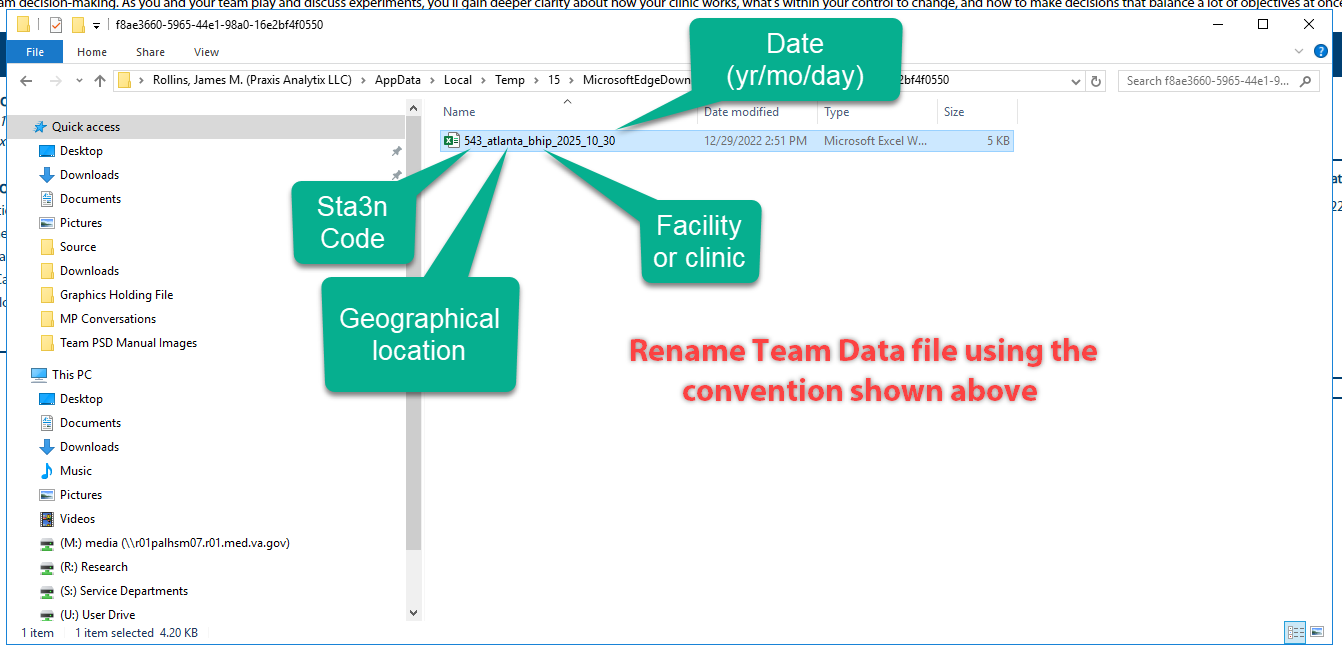
- Repeat steps 2-6 with Team Flow Selections.
Tips & Tricks:
Link to CPT Code Cheatsheet.
Use the most recent clinic selection table to find the full Sta6a. The folder for the site list xlsb file is located in the TeamPSD shared drive > Grants > 0_final_post_covid19_site_list.
Note: This site list is for SMEs and the internal team; it is not applicable for field users.
To clear filters/columns, click on the Eraser icon in the upper right of the filters/columns.
To reset ALL selections across ALL tabs, click the Reset button in the upper right hand of the bar.
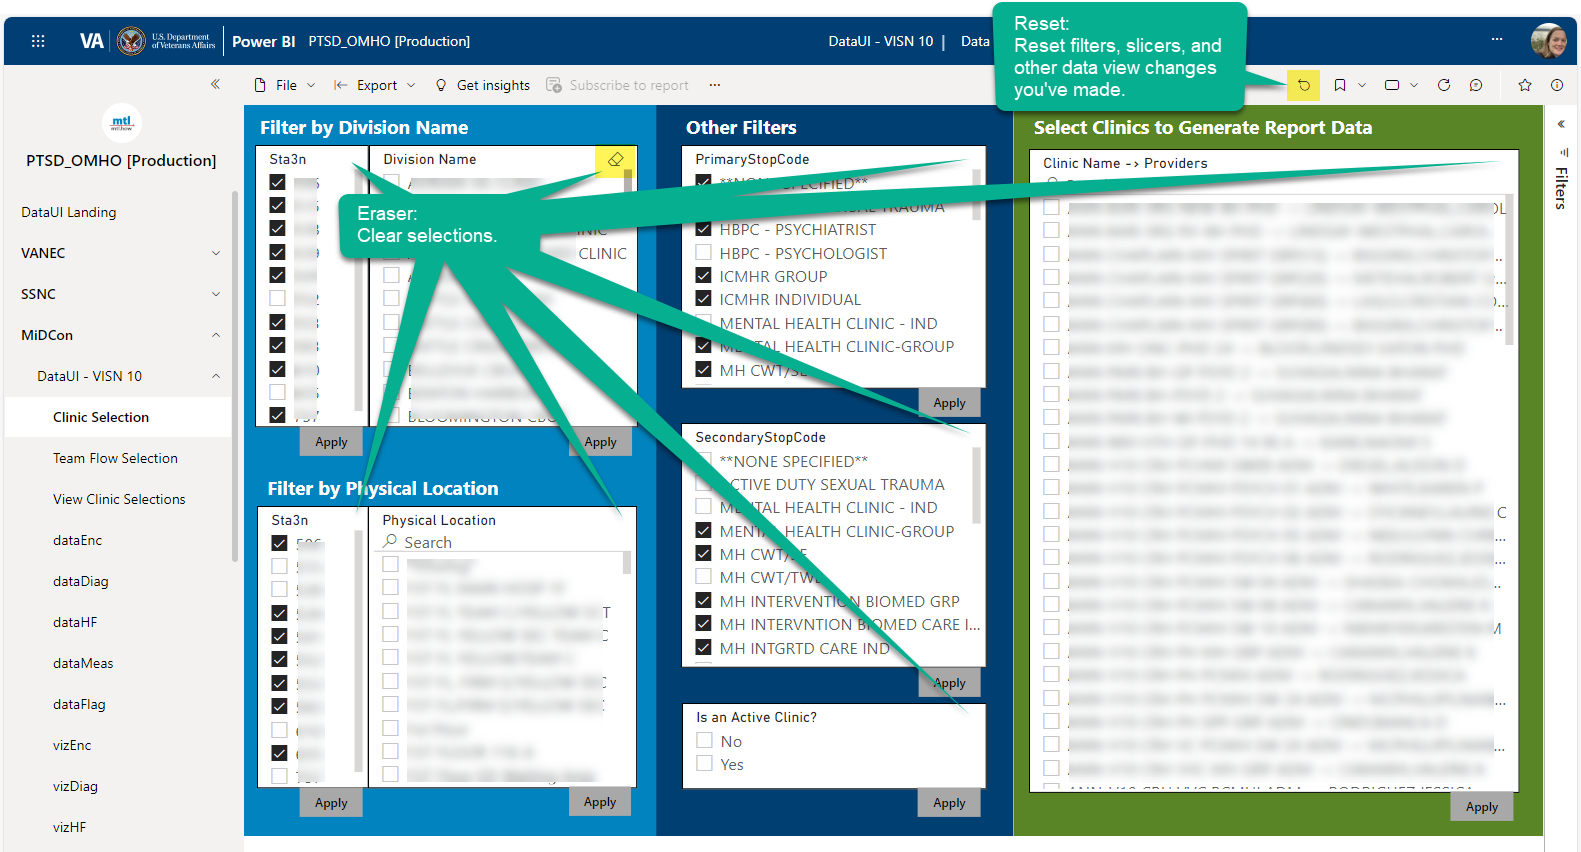
To zoom into the screen, hover in the upper right-hand corner of the screen until a set of icons appear.
- Click on the square Focus Mode icon. Click Back to Report to return to the previous view.
Note: Focus Mode is found in the data and viz tabs only.
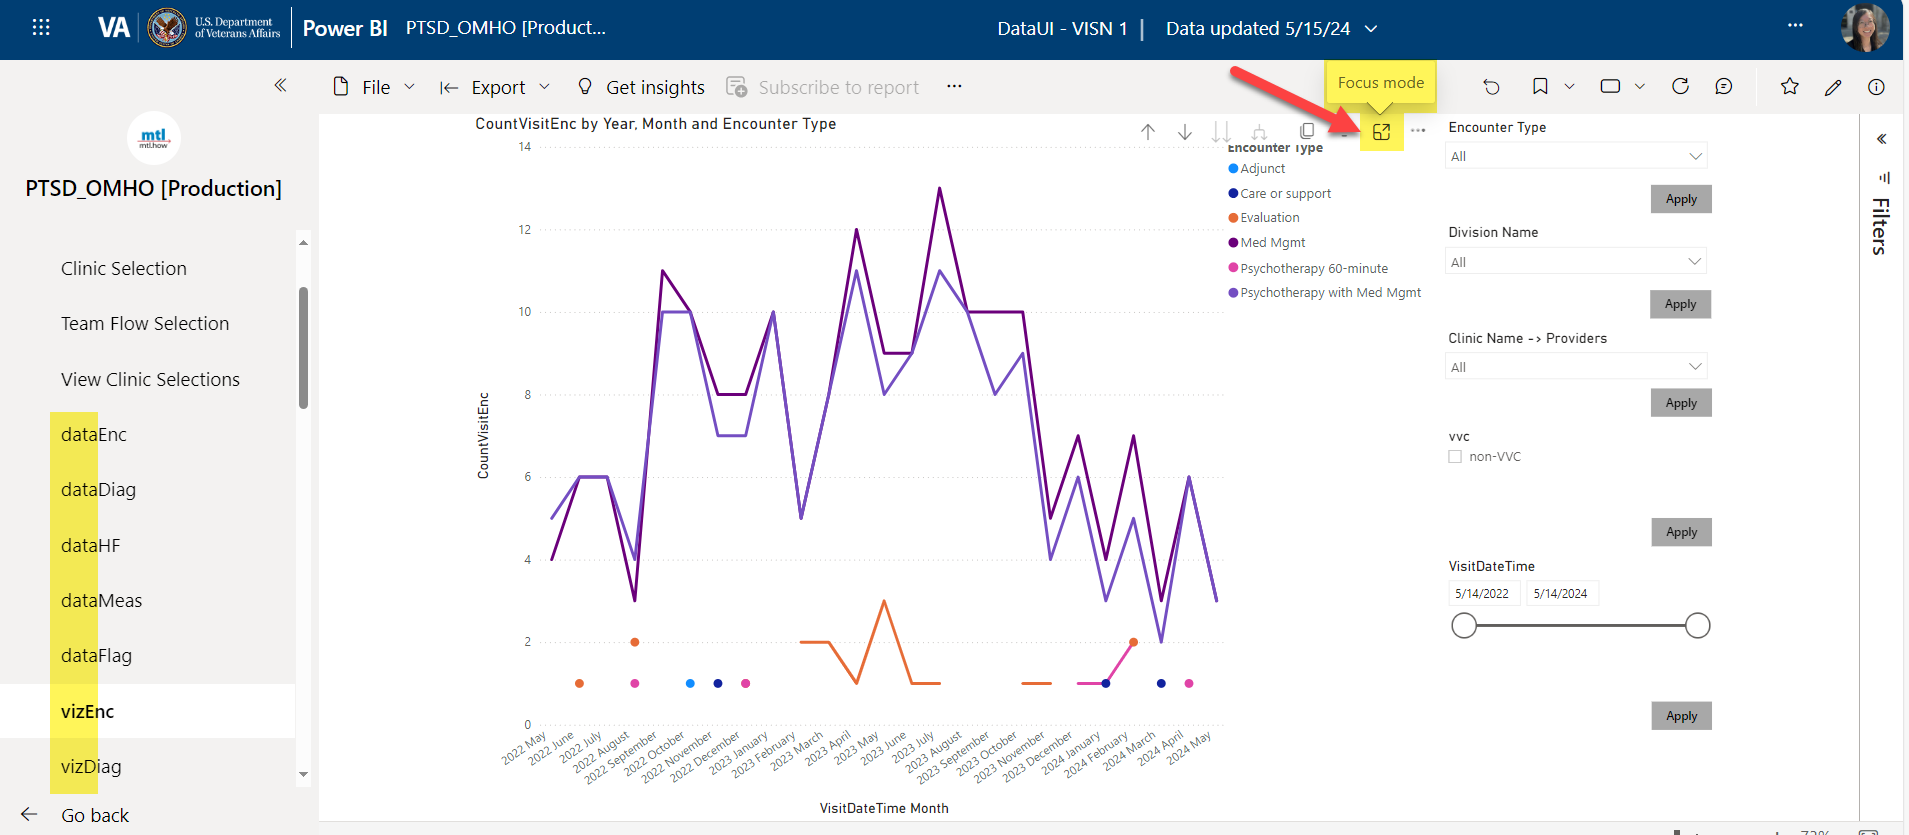
- Click to view the vizDiag tab which shows team trends.
Viz tabs are your reference modes - trends over time.
Zoom out and see team trends for diagnoses (Diag), encounters (Enc), health factor data (HF; e.g., suicide plans, evidence-based practice templates), measures (Meas), and behavioral and suicide risks (Flag) from Mental Health Assistant. Click on the respective tabs (Diag, Enc, etc.) to view these trends.
Another way to see encounters or services decreasing or increasing is by viewing the number of visits by right clicking on any trend line and click Show As Table.
Filter trends to zoom into a specific team trend by navigating to the right side of the screen and click on the Funnel icon to reveal the filter panel.
vizDiag in the Data UI shows a trend lines by diagnoses or combination of diagnoses. For example, the PTSD line is for patients with only PTSD. The PTSD & AUD line is for patients with both these diagnoses but does not discriminate between which is the primary, secondary, etc. diagnoses.
Tips & Tricks:
Right click on any trend line and click Show As Table to see encounters or services decrease or increase by viewing the number of visits.
Filter trends to zoom into a specific team trend by navigating to the right side of the screen and click on the “Funnel” icon to reveal the filter panel.
If you do not see something that you would expect or previously saw, check to see if a filter is applied.
Click on the funnel icon in the top upper right. Filters are active if it says “Filters and slicers affecting this visual.”
- Click to view the “data” tabs, which show your team’s individual patient information.
In the data tabs, providers can zoom in on specific veterans. Patient information corresponds to the same categories as the team trends: diagnoses (Diag), encounters (Enc), health factor data (HF; e.g., suicide plans, evidence-based practice templates), measures (Meas), and behavioral and suicide risks (Flag) from Mental Health Assistant.
Providers can filter to find specific patients or produce reports by navigating to the right side of the screen and clicking on the “Funnel” icon to reveal the filter panel.
Tips & Tricks:
dataDiag in the Data UI has an additional column after Diagnoses of Interest, called Primary Diagnoses, specifying which diagnosis is primary to help providers better understand the characteristics of the patient population.
Patients who have requested restricted access to their information have asterisks (******) in the Patient Name column. If you are a VA provider, you can still identify patients from the Patient SSN column, or Patient Name column.
If you do not see something that you would expect or previously saw, check to see if a filter is applied.
- Click on the funnel icon in the top upper right. Filters are active if it says “Filters and slicers affecting this visual.”
3.2.4 Request and Verify Local Server View Permissions
To pull patient and clinic level data, you need LSV permissions. Check which facilities you have LSV access for here through VA intranet. Clinical Resource Hub Providers are granted to multiple local server access.
If you do not have access to facilities that you believe you should, please verify:
CPRS access/permissions at your station (i.e., COR tab access for CPRS).
Your network username recorded in VistA. To have your network username recording in VistA, please follow instructions here through VA intranet.
If you are still unable to pull data or access the Data UI, please email us at MTL.Help@va.gov
Note: If you need access to all sites (e.g., national), click here and follow the steps in Request Access to Data Tools section.
3.2.5 Request Access to Data Tools
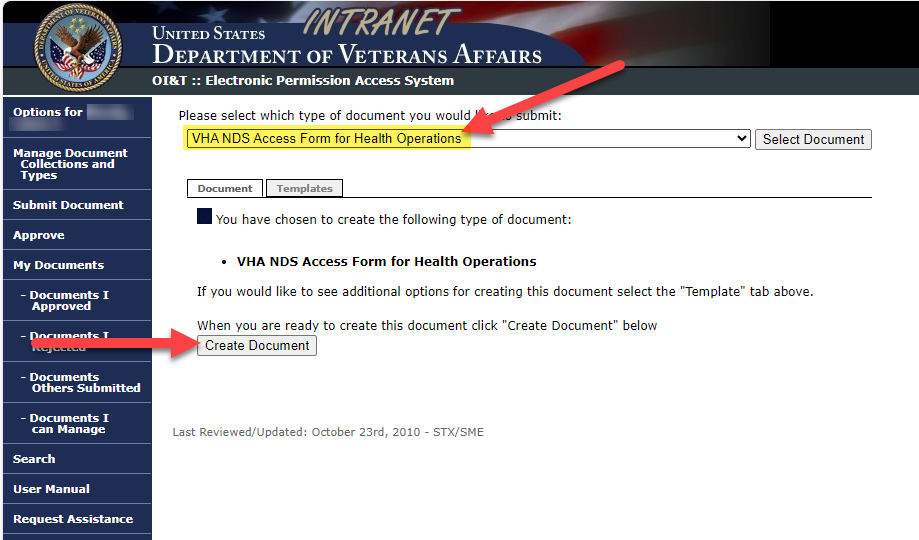
Click here to access the OI&T Electronic Permission Access System.
Verify VHA NDS Access Form for Health Operations is selected in the Select Document dropdown, then click Create Document.
Fill in the form as follows:
Note: the following fields will be pre-populated: Full Legal Name, Job Title, Email Address, Active Directory Name with Domain, and Work Telephone Number.
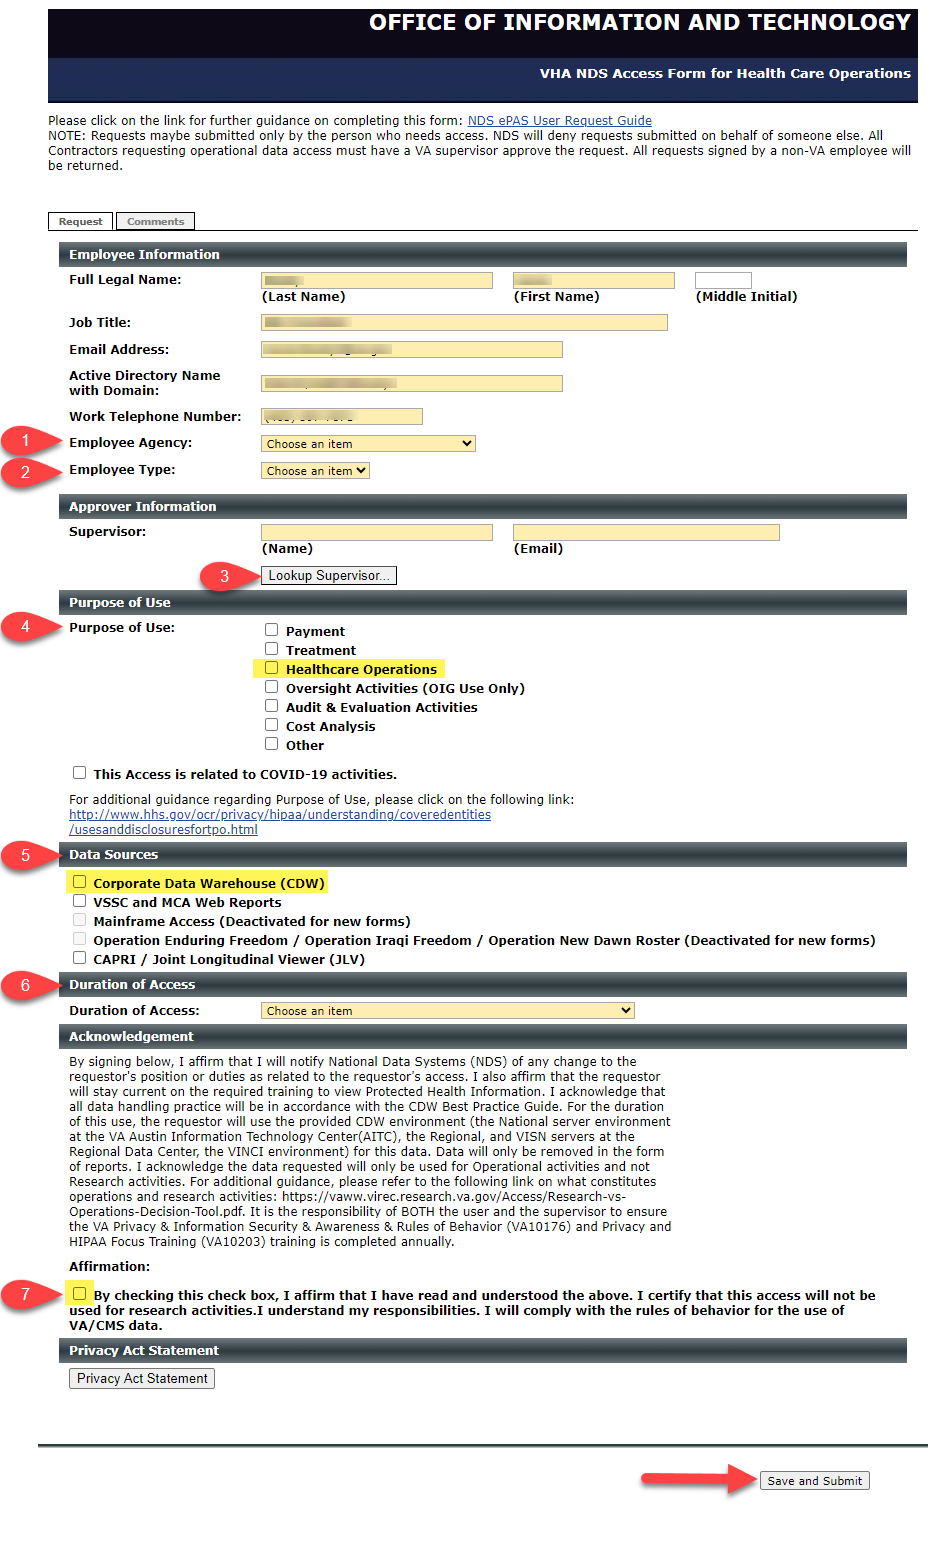
1 - Employee Agency: Veterans Health Administration
2 - Employee Type: VA Employee (yes, for all of you, none of you are “contractors”). New fields will appear.
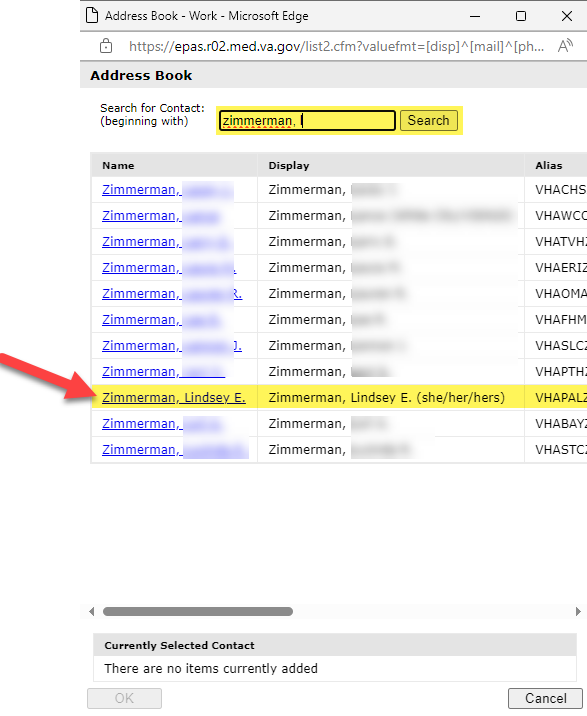
3 - Lookup Supervisor: Search for “zimmerman, l”.
4 - Purpose of Use: Healthcare Operations
5 - Data Sources: Select Corporate Data Warehouse (CDW)
6 - Duration of Access: Select “I will need access during the duration of my position.” from the dropdown.
7 - Affirmation: Check the box.
- Scroll towards the top of the screen and select the Corporate Data Warehouse (CDW) tab.
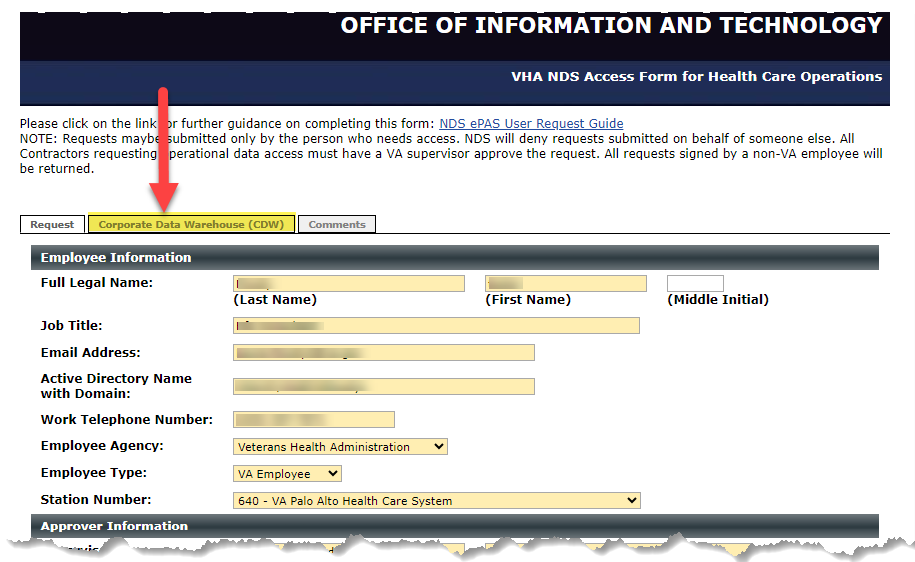
- Make the following selections after selecting the CDW SQL Datasets checkbox:
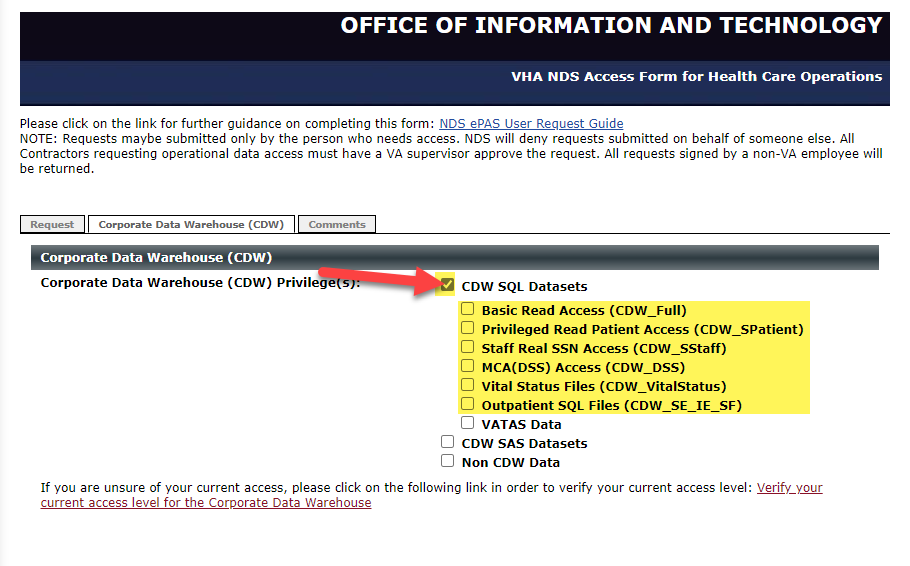
- Basic Read Access (CDW_Full)
- Privileged Read patient Access (CDW_SPatient)
- Staff Real SSN Access (CDW_SStaff)
- MCA (DSS) Access (CDW_DSS)
- Outpatient SQL Files (CDW_SE_IE_SF)
- Now select the Comments tab. Copy/paste in the following rationale provided to you:
I support the Modeling to Learn national operational quality improvement project led by the VA Office of Mental Health and Suicide Prevention (OMHSP). This initiative includes a national Power BI Report in which frontline staff access local operations data as part of their quality improvement activities.
- Click Save and Submit.
3.2.7 Begin a Session in the Dynamic Decision Dashboard
Tip: Refer to this one-page Sim UI Cheatsheet when familiarizing yourself with the Dynamic Decision Dashboard.
Beginning a session in the Dynamic Decision Dashboard (DDD) allows users to look at the stocks and flows across all five modules. It also helps determine which module(s) to prioritize, based on the location of the greatest accumulation to leverage for change.
Learners can see the same accumulations and learn where to prioritize based on the location of the greatest accumuation to leverage for change.
Navigate to the selected team’s Home page. If you aren’t sure how, see Navigate to the Home Page of Any Team.
Select the desired team data file from the Please Select Team Data dropdown and click GO! A Learning Mode pop-up will appear.
Tip: If multiple members of a team want to review the DDD at the same time, it is highly recommended to take turns initializing (pressing Go!). Otherwise, some users may not be able to successfully initialize the DDD modules.
Notes:
Team PSD members will have uploaded the same Team Data file into the _team world for everyone at that consult location.
Learners can see the same accumulations and learn where to prioritize based on the location of the greatest accumuation to leverage for change.
Although learners see the same information, it is still your own unique session (behind the scenes).
There are ways to play in the same world and learn together within each module: Care Coordination, Team Care, Medication Management, Psychotherapy, and Team Flow.
If there is not a team data file in the dropdown, follow these steps.
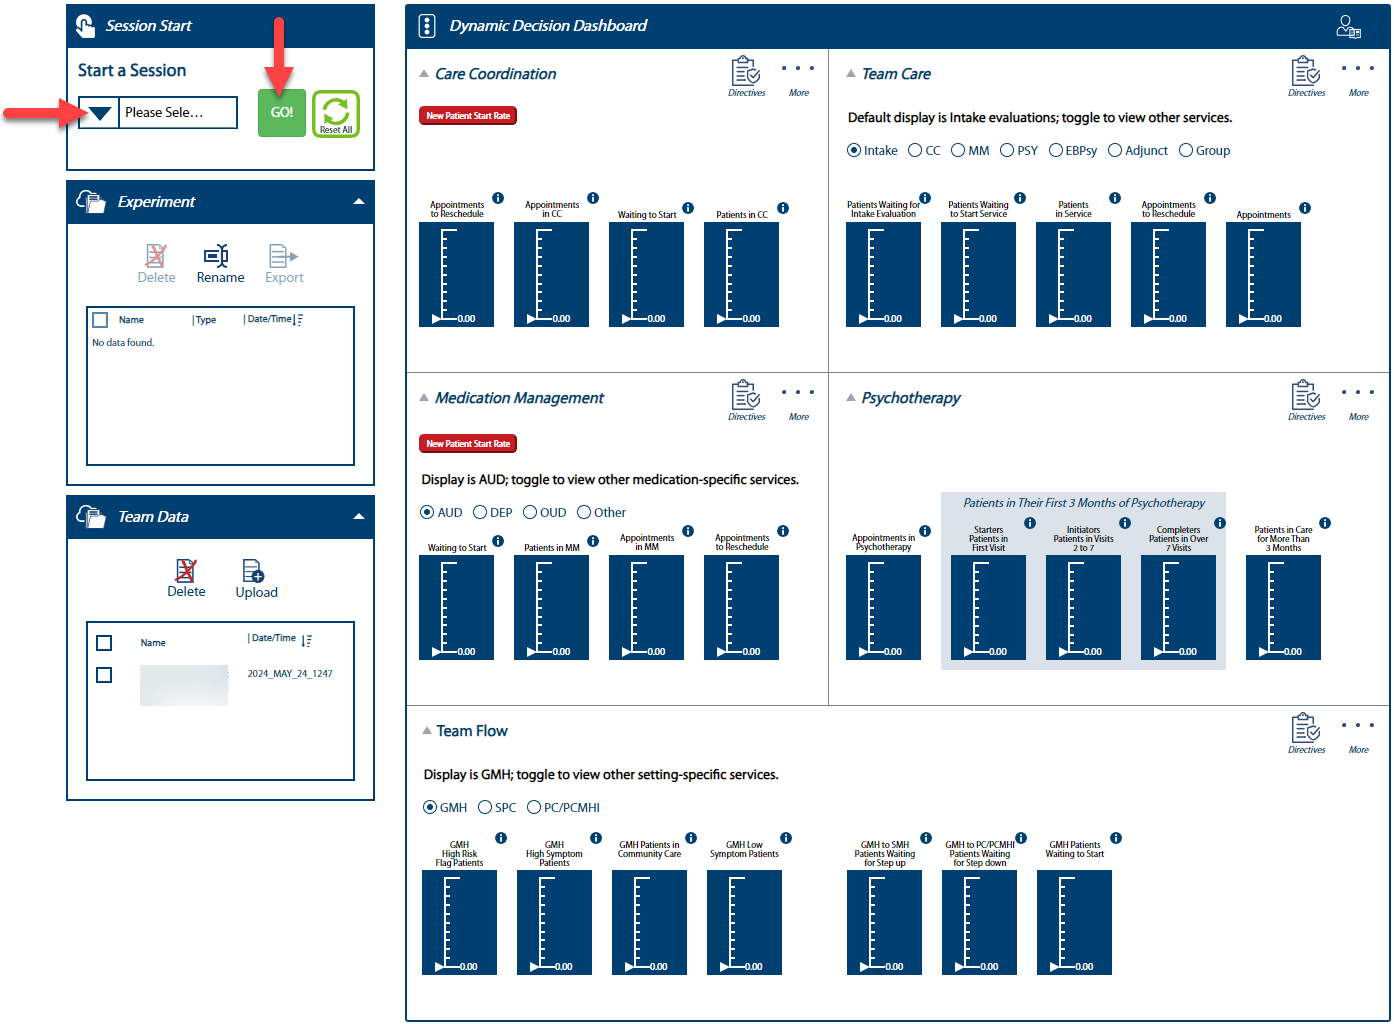
- Make CC and MM Learning Mode selections using the radio buttons, then click Continue to initialize all modules within the Dynamic Decision Dashboard.
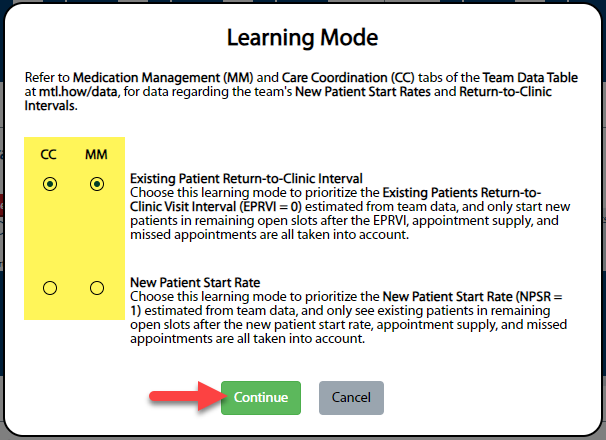
Notes:
- Existing Patients Return-to-Clinic Visit Interval (EPRVI) = learning mode “0”.
- New Patient Start Rate (NPSR) = learning mode “1”.
- Refer to the Care Coordination (CCParams) or Medication Management (MMParams) tab of the Team Data Table at mtl.how/data, for data regarding the team’s New Patient Start Rates and Return-to-Clinic Visit Intervals.
3.2.7.1 Maintain Experiments
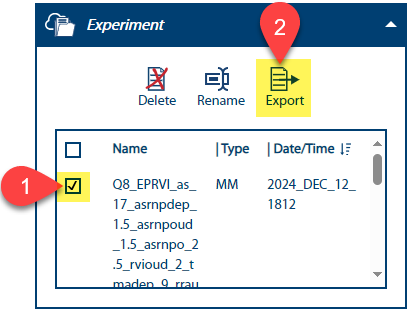
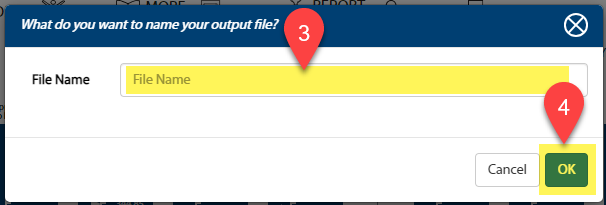
Expand the Experiment blue bar on your team’s Home page to reveal the Experiment maintenance window and its options: delete, rename, and export.
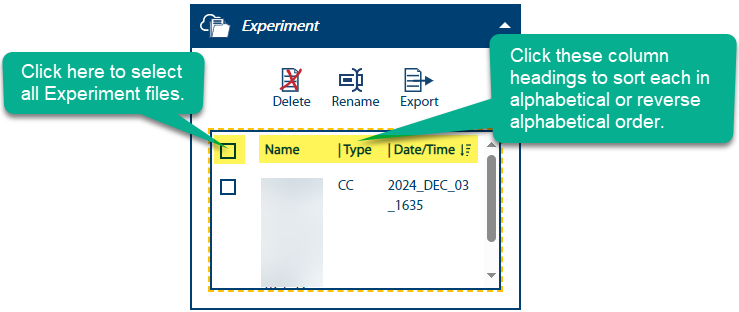
3.2.7.1.1 Delete Experiment(s)
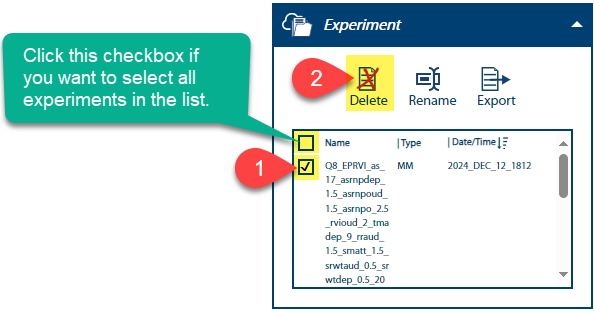
- Select at least one experiment to delete.
- Click the Delete icon.
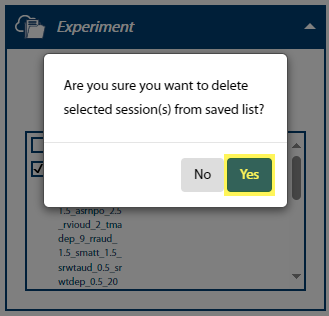
- Confirm you want to delete selected experiment(s) from the list.
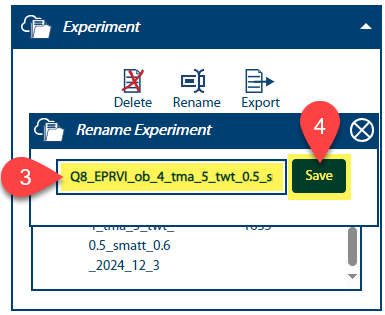
3.2.7.1.2 Rename an Experiment
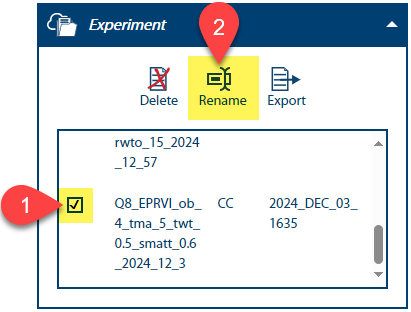
- Scoll to and select an experiment to rename. Only one may be chosen at a time to rename.
- Click the Rename icon.
- Click within the name field and rename the experiment.
- Note: There are specific parameters to renaming an experiment. Accepted filenames must only contain:
- Uppercase & lowercase letters
- Digits
- Hyphens
- Underscores
- Periods - While periods are accepted (because the Sim names files using them), it is currently not supported to rename a file and keep the periods in the filename. If you want to change the filename, all periods will have to be removed and/or replaced with a hyphen or underscore.
- Click Save.
3.2.7.2 Maintain Team Data
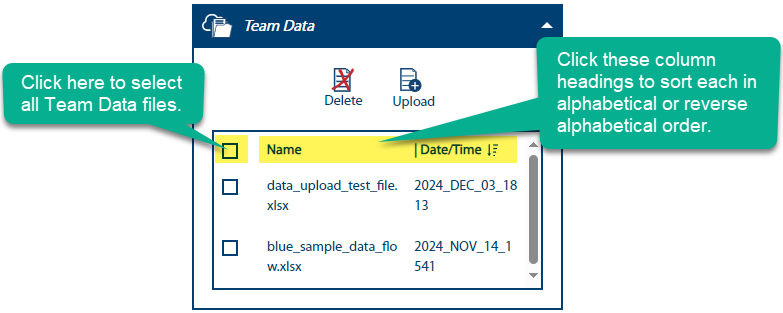
Expand the Team Data blue bar on your team’s Home page to reveal the Team Data maintenance window and its options: delete and upload.
3.2.7.2.1 Delete Team Data
- Select at least one Team Data file to delete.
- Click the delete icon.
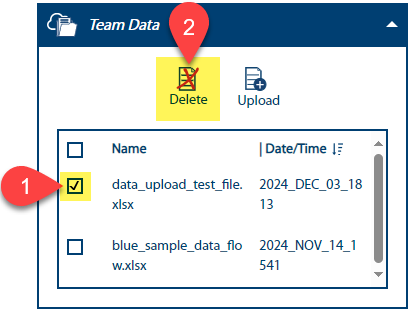
- Confirm you want to delete selected Team Data file(s) from the list.

3.2.7.2.2 Upload Team Data
- Select Upload:
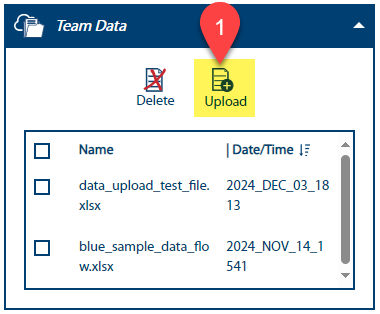
A pop-up window will appear asking if the data file is in Power BI format. Ensure it is and click Yes to proceed. The File Manager will appear.
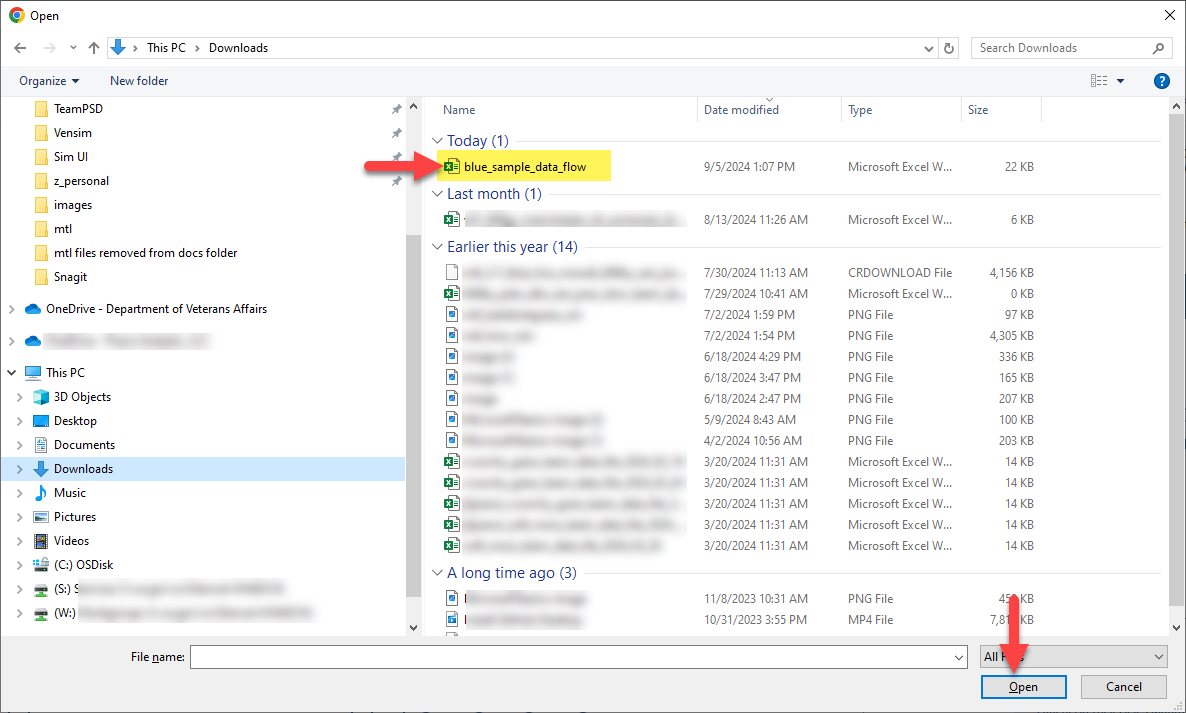
Navigate to the location of the downloaded team data file and click on the file name. Click Open to upload the file. Be patient; it may take a while for the file to upload.
Notes:
- Be patient; it may take a while for the file to upload.
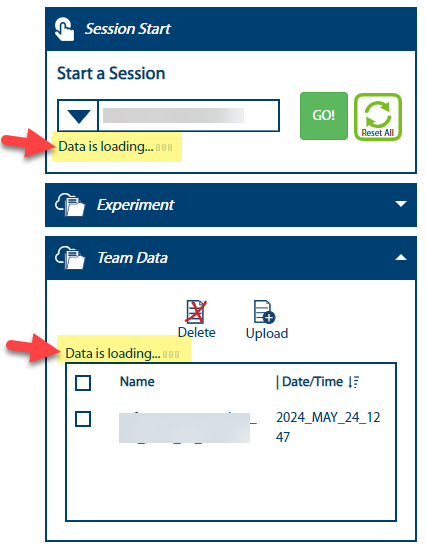
- As the data file is uploaded, you will see “Data is uploading…” and three flashing loading bars in the Session Start and Team Data sections. These messages clear once the file is loaded into the Sim.
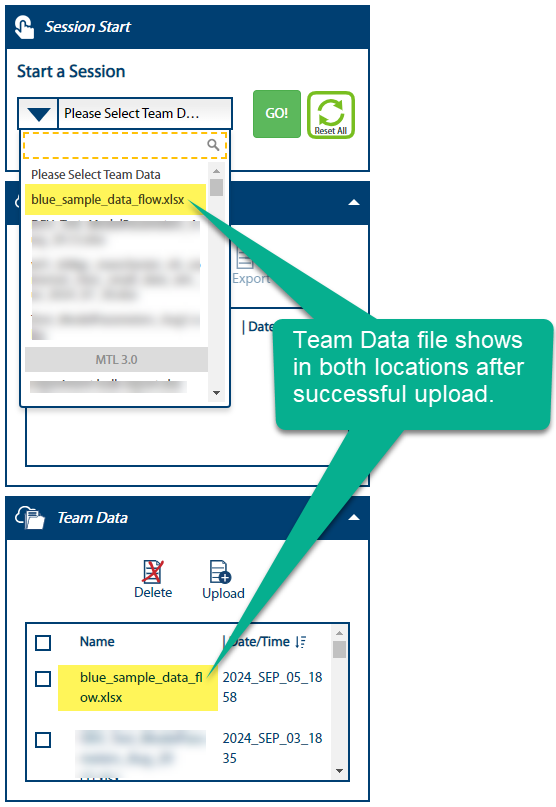
- The team data file name should now appear in the Team Data list and in the Please Select Team Data dropdown.
3.2.8 Dynamic Decision Dashboard
The Dynamic Decision Dashboard (DDD) is a convenient visual way to help answer the question Where is the volume (of Veterans) across all modules? The DDD is for everyone (clinicians, consultants, nurses, etc.) to test their assumptions and hypotheses. The primary purpose of these visuals is to help understand the dynamic system that is Veteran care. The dashboard shows a visual representation of where Veterans accumulate (creating lags in the system), where Veterans are waiting to start, and the services in which these behaviors are observed. This aids in understanding how different quantities change and interact over time and identifying key variables that contribute to the accumulation or depletion of stocks. The DDD allows clinicians to make new clinical decisions that are among their most common decisions, resulting in high-leverage change(s) that are the most influential decisions that impact the behaviors of the Veteran care system, and empowers teams to understand how to zoom in to get a particular Veteran the right treatment at the right time or zoom out to understand how all the individual decisions aggregate over time to determine the dynamics of the system.
3.2.8.1 Understand the Five Modules
There are five modules within the Dynamic Decision Dashboard, each of which is described below:
Care Coordination: shows how a variety of team decisions interact to impact multiple outcomes at the same time. You can explore trade-offs between decisions such as desired new patient wait times, current patient return visit intervals, and overbooking, and how they affect team outcomes like total missed appointments, number of patients in care, and number of patients completing care.
Team Care: gives insights about RVI and service proportions, and shows how a variety of team decisions interact to affect your overall mix of services. You can explore trade-offs between decisions such as desired new patient wait times, current patient return visit intervals, and overbooking, and how they affect team outcomes like total missed appointments, number of patients in care, and number of patients completing care. You can compare the effects of different decisions on outcomes in one service, or you can compare the effects of one decision on different services.
Medication Management: enables you to experiment with how team decisions about referrals, time allocation, and visit frequency impact the quality of medication management for patients. Your team can explore scenarios to balance these trade-offs and better meet the specific needs of patients with depression, alcohol use disorder, and opioid use disorder. Insights you gain can help you increase local reach of evidence-based pharmacotherapies.
Psychotherapy: shows how team psychotherapy decisions interact and depicts patterns of psychotherapy engagement in your team. You can explore solutions to the challenges of getting patients to complete a full course of therapy, while also achieving goals to start enough new patients in psychotherapy. Insights about these dynamics can be used to increase the local reach of evidence-based psychotherapies.
Team Flow: shows the effects of measurement-based stepped care on patients’ symptoms and risk. It allows you to explore the impacts of implementing measurement-based care to reduce delays in detecting patients at high risk for suicide, and to improve the quality of care by making better team decisions about when to step patients up to a higher level of care, or step them down to a lower level of care. It is also possible to experiment with team decisions related to new patient wait times and access, the use of community care, and the impacts of provider overwork and burnout on the quality of care.
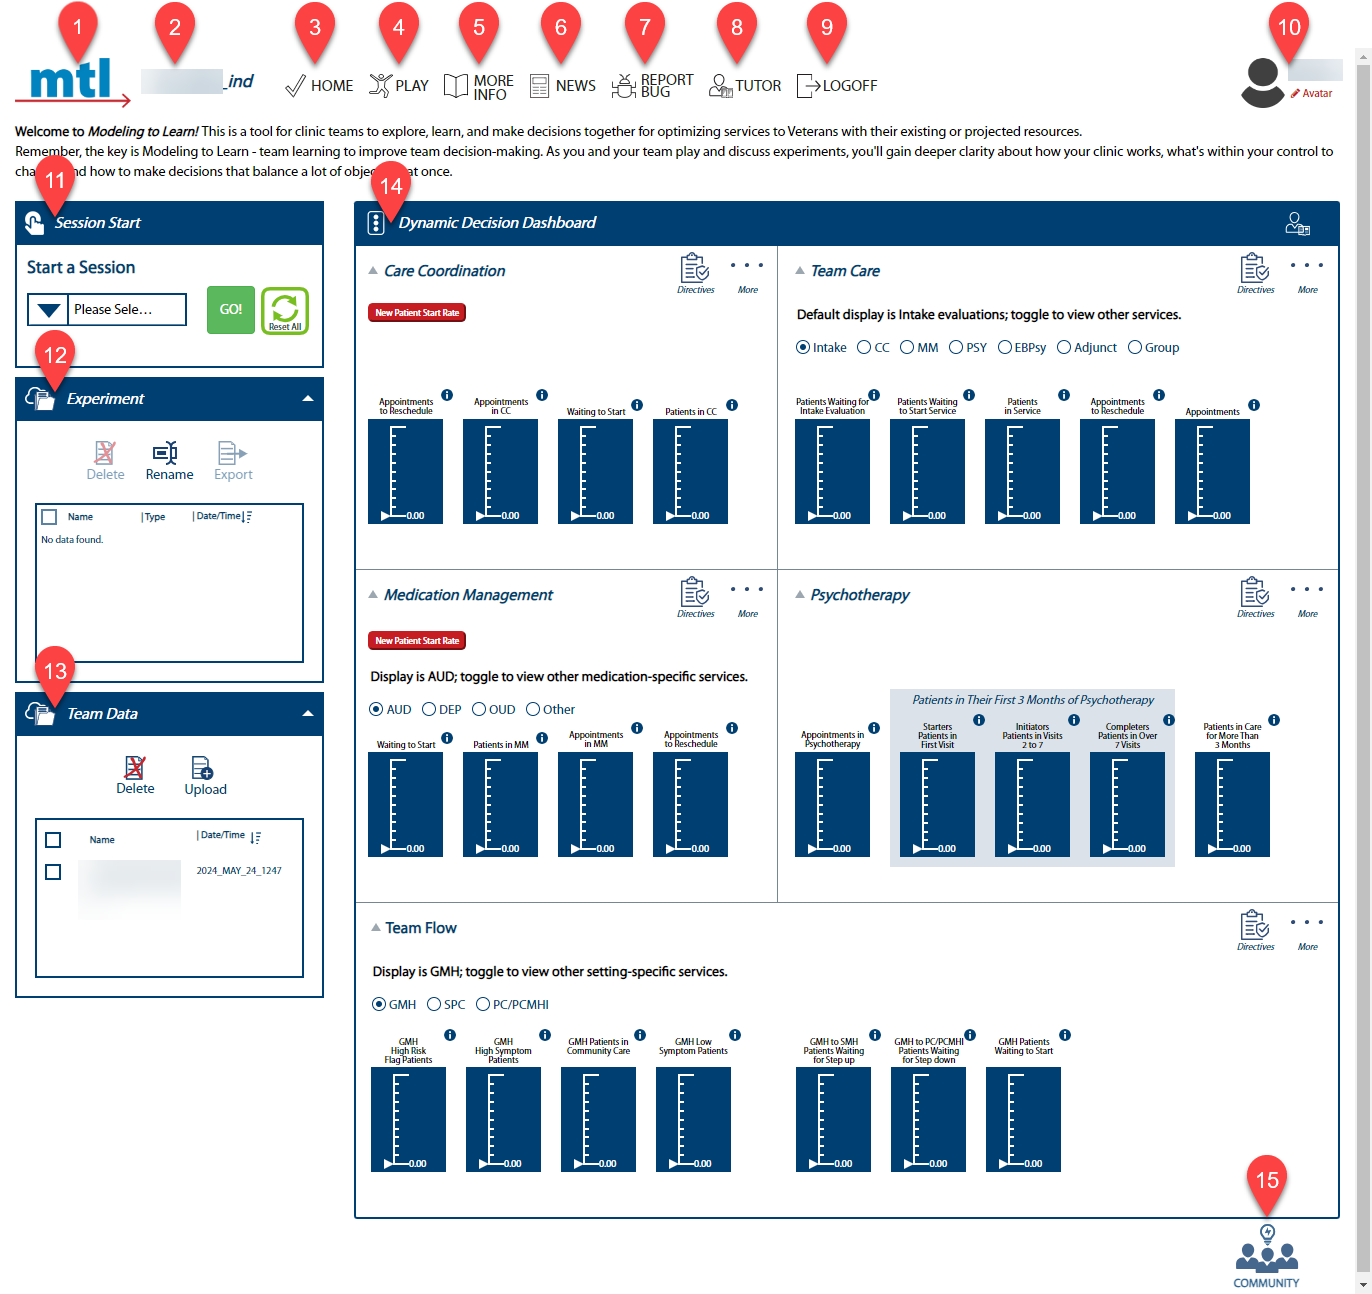
3.2.8.2 Orient to the Dynamic Decision Dashboard
Below is an orientation to the Dynamic Decision Dashboard.
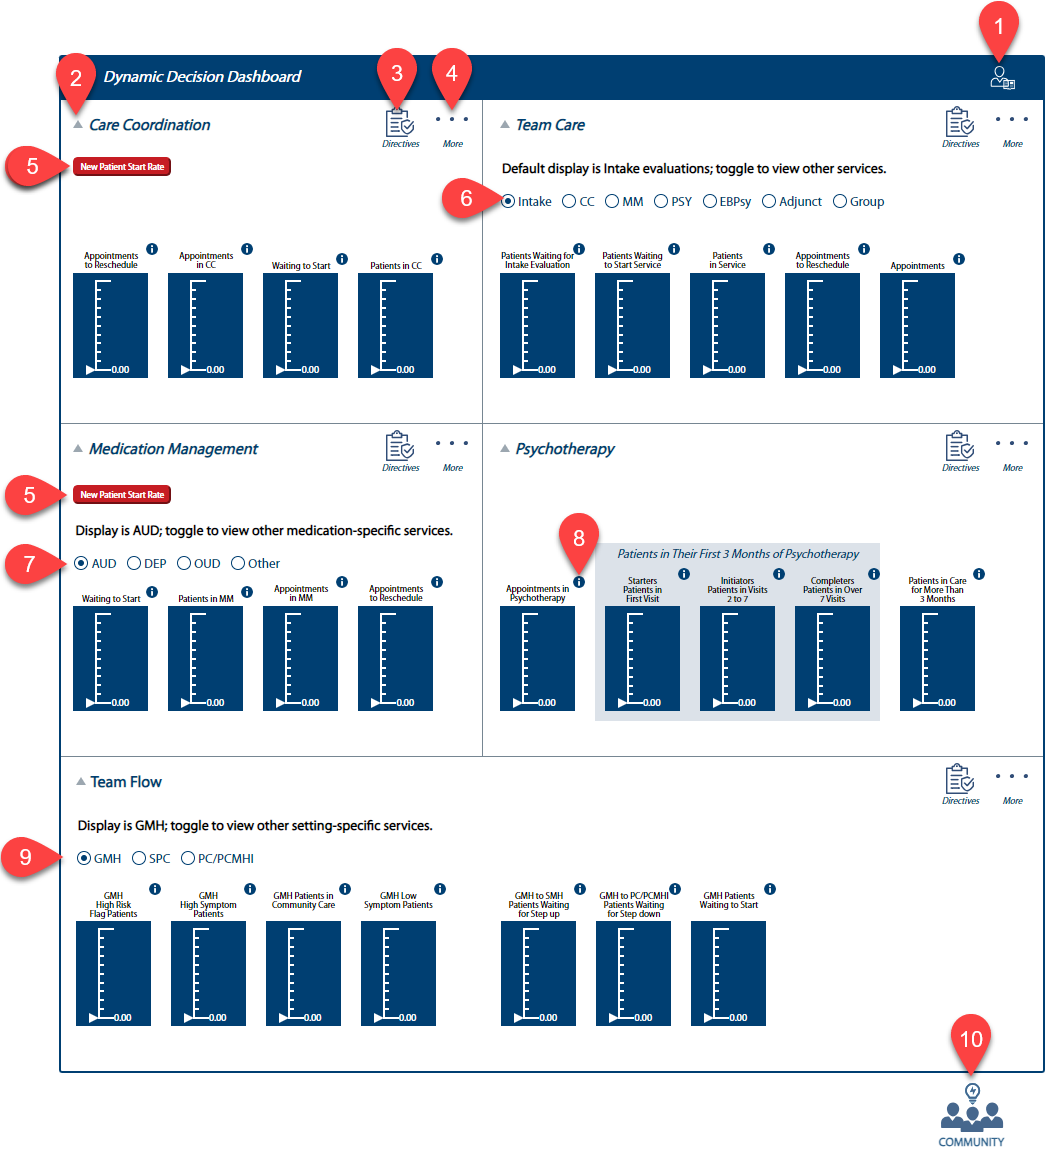
Tutor: Click for a guided tour of page features.
Caret: Click carets next to each module to contract or expand that module from view.
Directives: Click to show a Directive 1160.01 to MTL crosswalk table that identifies specific references within Directive 1160.01 that requires actions by facilities that are supported by the Data UI and the Sim UI. These actions are linked to MTL reports and MTL use cases that reinforce how the directives are supported in application by other facilities.
More: Click to reveal other key views of the Care Coordination module. All modules have this feature. Depending on the module selected, the More menu may include:
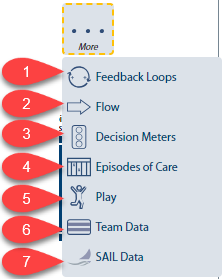
1 - Feedback Loops: Interactive diagrams that aid in visualizing how different variables in a system are causally interrelated. Clicking here will open a pop-up window that shows an associated loop diagram along with Causal Loop Dynamics selections.
2 - Flow: Visualized in Sankey form, these diagrams help visualize the rate of flow into and out of stocks. A stock is a state of care in which patients can accumulate over time. Sankey is a type of flow diagram where the width of the arrows is proportional to the flow quantity.
3 - Decision Meters: A quick method to visualize the relevance or significance of different aspects within a group.
4 - Episodes of Care: Graphically shows evidence-based episode of care intervals to get a bird’s eye view of how long the length of engagement will be.
5 - Play: Enter the main Sim UI page to see the system story and run experiments. You can learn together if you click Play and join an ongoing session in one of the modules.
6 - Team Data: A quick link to the Modeling to Learn Data User Interface that will open in a new browser tab.
7 - SAIL Data: A quick link to Strategic Analytics for Improvement and Learning Value Model (SAIL), a system for summarizing hospital system performance within Veterans Health Administration (VHA). This will open in a new browser tab.
Learning Mode Labels: Indicates which Learning Mode the data prioritizes. Click these buttons to change the learning modes directly from the DDD; the system will re-initialize based on the new learning mode selected. Existing Patients Return-to-Clinic Visit Interval (EPRVI) = learning mode “0” and New Patient Start Rate (NPSR) = learning mode “1”.
Team Care Services Radio Buttons: Select desired service radio button to see stock values for specific services in Team Care (Intake, Care Coordination, Medication Management, Psychotherapy, Evidence-based Psychotherapy, Adjunctive Services, Group Therapy). The default display is Intake evaluations.
Medication Management Services Radio Buttons: Select desired service radio button to see stock values for medication-specific services in Medication Management (Alcohol Use Disorder, Depression, Opioid Use Disorder, and Other). The defaut display is Alcolol Use Disorder.
“i” icon: Click “i” icons to read the definition of each stock label.
Team Flow Services Radio Buttons: Select desired service radio button to see stock values for setting-specific services in Team Flow (General Mental Health, Specialty Mental Health, Primary Care/Primary Care Mental Health Integration). The default display is General Mental Health.
Community: Click here to participate by sharing an idea, letting the team know what you like, asking a question, or joining our community.
3.2.8.2.1 Feedback Loops
A systems view and understanding is reinforced through the use of funcational causal loop diagrams accessible directly from the DDD. These diagrams are interactive and help visualize how different variables within the system of veteran care are causally interrelated. Feedback loops involve the output of a system being fed back into the system as input. They are essential for understanding and analyzing the behavior of dynamic systems.
Each story has its own unique feedback loop that shows named balancing and reinforcing feedback loops and the whole system story with polarities. For illustrative purposes, the Team Flow Story is used as an example below (with all causal loop dynamics shown) to orient you to general feedback loop window features.
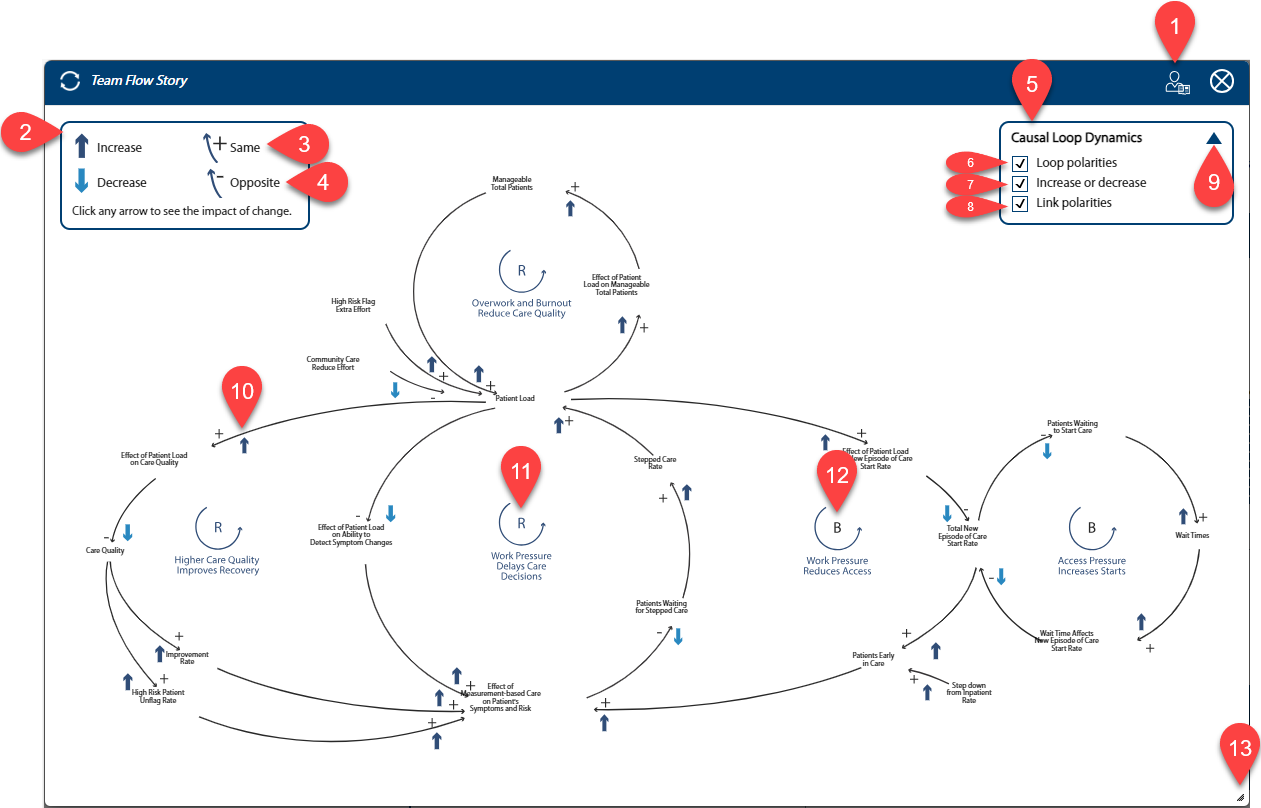
Note: Click and hold the blue bar at the top to move the pop-up to a desired position on the screen.
Tutor: The Tutor button will introduce you to the features of this page.
Key: This displays the key for all feedback loops.
Positive Causal Arrow: Values at the arrow’s tail (cause) and point (effect) change in the same direction; both increase or both decrease. The plus sign means it is a direct relationship.
Negative Causal Arrow: Change in the value at the arrow’s tail (cause) make the value at the point (effect) change in the opposite direction. The minus sign means it is an inverse relationship; when one increases, the other decreases.
Widget: Use the checkboxes to show or hide different loop dynamics.
Link polarities Checkbox: Select and deselect to show or hide link polarities; the diagram will build as defined.
Loop polarities Checkbox: Select and deselect to show or hide loop polarities; the diagram will build as defined.
Increase or decrease Checkbox: Select and deselect to show or hide increase and decrease polarity arrows; the diagram will build as defined.
Widget Dropdown: Click here to show or hide the widget.
Polarity Arrow: When these arrows are displayed, users can select any of the arrows by clicking and flip the increase or decrease icons. All the icons in the loop will then flip according to their relationship.
R Reinforcing Loop: This is a reinforcing loop; it reinforces runaway increase or decrease - virtuous or vicious behavior.
B Balancing Loop: This is a balancing loop; it keeps things in balance - stable or stubborn behavior.
Window Size: Click and drag to resize this window.
Exit: Click to close this window.
3.2.8.2.2 Flows
Flow meters are visualized in Sankey form. Sankey is a data visualization technique that uses a flow diagram to depict the movement of a quantity (Veterans) through stocks (a state of care) over time. The width of the arrows is proportioinal to the flow quantity, which allows viewers to easily identify the largest flows within a system.

The stock or state indicator key is located at the top right of each flow diagram pop-up for quick reference. A stock is a state of care in which patients can accumulate over time. In the Sim UI, stocks change coor based on their state. When the invlow exceeds the outflow, patients accumulate and the stock is red. When the inflow is equal to, or less than the outflow, patients flow and the stock is blue. This allows viewers to easily identify bottlenecks within a system.
Each module has its own unique flow dynamics. For illustrative purposes, the Psychotherapy Flow Diagram is used as an example below to orient you to general flow diagram features.
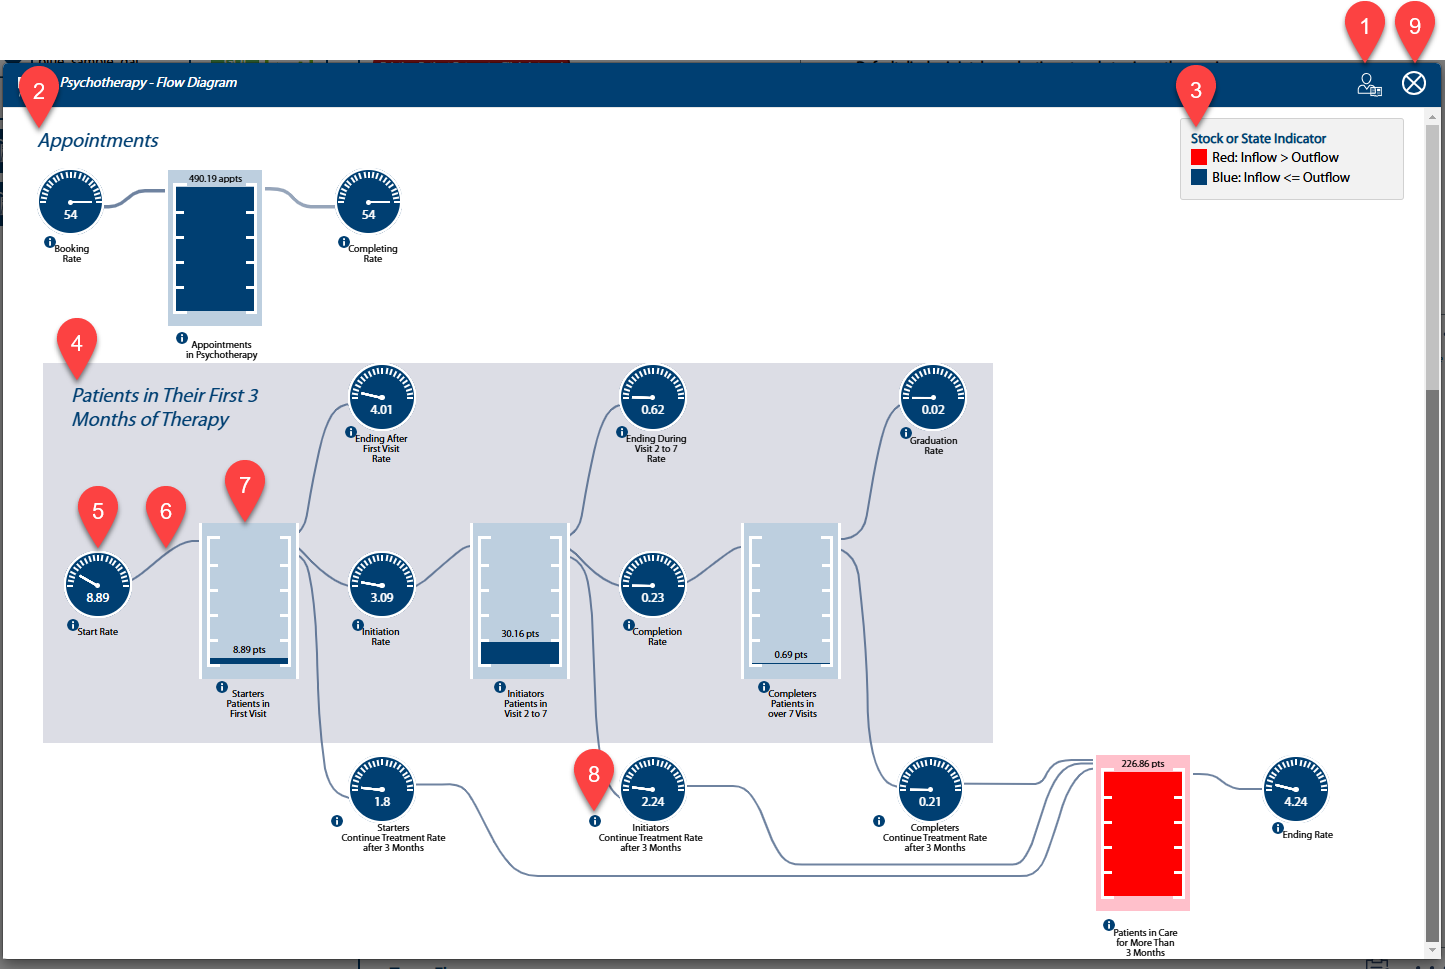
Tutor: The Tutor button will introduce you to the features of this page.
Appointments: The top part of the diagram depicts the flow of appointments within PSY.
Key: Refer to this key to understand color coding of the stock or state indicator.
Patients: The bottom part of the diagram depicts the flow of patients within PSY.
Dial: A dial indicates rate of flow into the stock at the point of the arrow—here, the dial indicates the number of patients per week starting their first visit.
Proportional Flow Lines: The width of the flow lines under this pin are proportional to the flow quantity. To aid in comparing inflows and outflows, they appear in the same fixed order.
Stock Rectangle: This stock indicates the total number of patients scheduled for their first visit. The level of a stock is determined by the rates of flow into and out of it.
”i” icons: Click any “i” icon in the Sim UI for a pop-up with more information about the labeled feature.
Exit: Click to close this window.
3.2.8.2.3 Decision Meters
Decision Meters are a quick infographic-based way to identify the highest leverage points and are highly supportive of clinical decision-making; they are for “decider” users who need systems thinking insights. The meters provide a visual interface that provides real-time feedback on ranges in our primary MTL units of patients/week and appointments/week. The traffic light reflects the current state results and recommendation of future state results. Through dialogue with decision-makers, consultants and field users manually input values into this graphic generator so the decision meters reflect the recommendations based on the alternative scenarios/experiments run by the learner. Decision meter numbers should be reflected in the “D” box of the Q/H/F/D outputs text field within the Sim UI, usually as ranges of numbers.
- Care Decision Meters are for MTL Blue teams only.
- Click within each decision meter to edit. Remember to click Save if you want the values to remain!
For illustrative purposes, the Medication Management Decisions window is used as an example below to orient you to general Decisions pop-up window features.
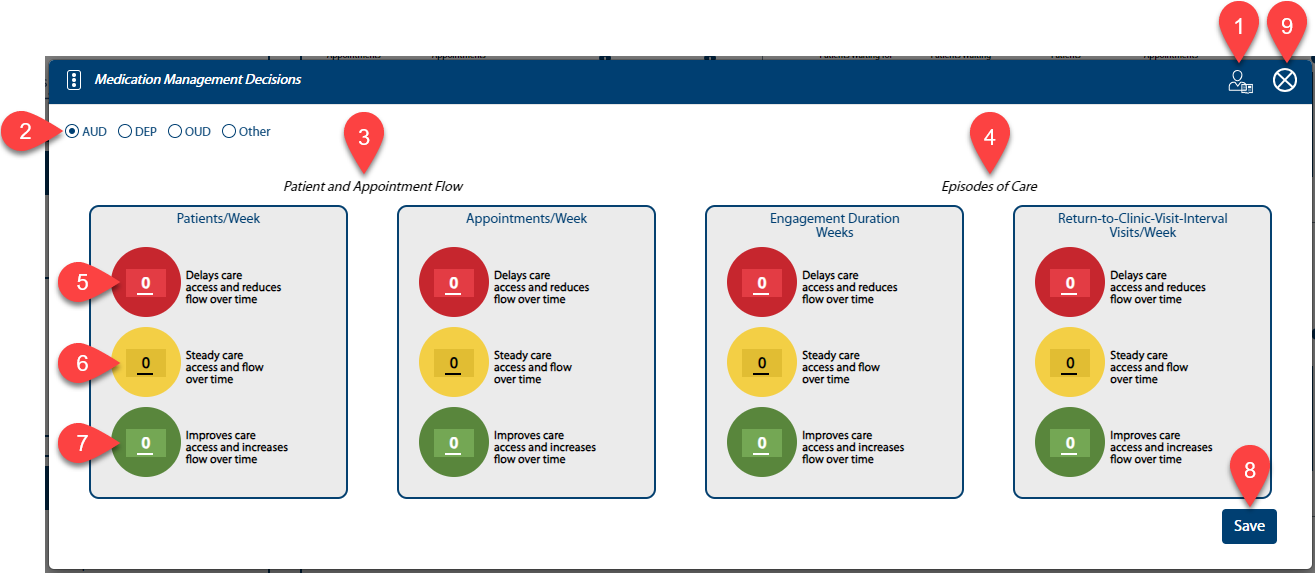
Tutor: The Tutor button will introduce you to the features of this page.
Service Options: Click a radio button to see stock values for specific services. Hovering over the abbreviations will display the entire service name.
Patient and Appointment Flow: Suggested Patient and Appointment flow.
Episodes of Care: Suggest treatment length and frequency.
Red: Click in the shaded text field of any red circle (greater net inflow to outflow) to input a value (up to 4 digits).
Yellow: Click in the shaded text field of any yellow circle (equal inflow to outflow) to input a value (up to 4 digits).
Green: Click in the shaded text field of any green circle (lesser net inflow to outflow) to input a value (up to 4 digits).
Save: Click to save the entered values.
Exit: Click to close the pop-up window.
3.2.8.2.4 Episodes of Care
Timely access to high-quality care includes improved understanding of dynamic tradeoffs in the Return-to-Clinic Visit Interval (RVI) and engagement durations. The Episodes of Care pop-up is used to graphically show evidence-based episode of care intervals to get a bird’s eye view of how long the length of engagement will be. Available within the Medication Management, Psychotherapy, and Team Care modules, this pop-up integrates engagement duration and RVI for both Medication Management and Psychotherapy.
The following screenshot will orient you to general features of this pop-up.
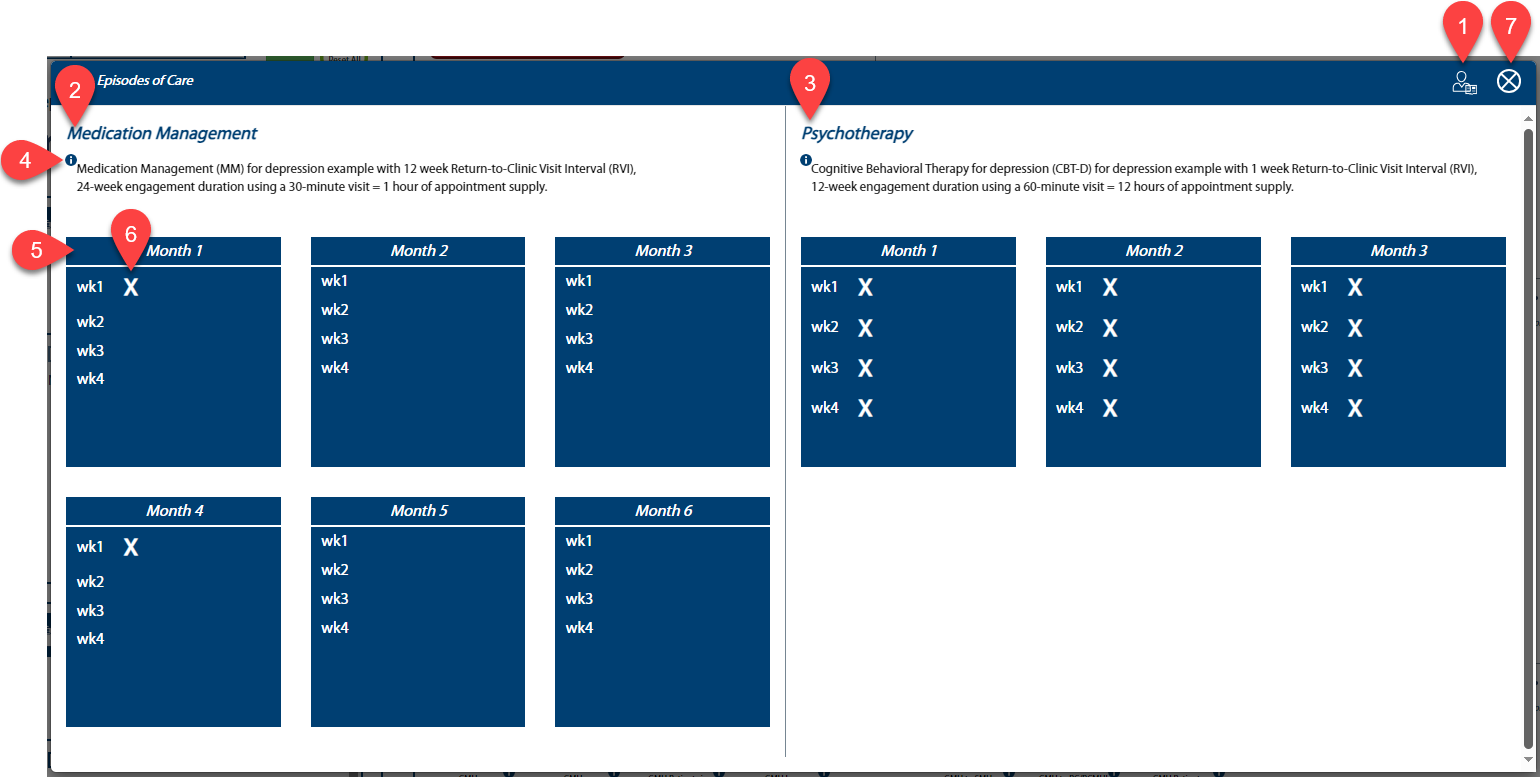
Tutor: The Tutosr button will introduce you to the features of this page.
Medication Management example: Medication Management example shown side-by-side with Psychotherapy to illusttrate a tradeoff in service proportions being used.
Psychotherapy example: Psychotherapy example shown side-by-side with Medication Management to illustrate a tradeoff in service proportions being used.
“i” icon: Click to view the CPT Code Cheatsheet in a new browser tab.
Time Box: Each rectangle represents one month.
Appointment: “X” represents a Return-to-Clinic appointment.
Exit: Click to close the pop-up window.
3.2.9 Enter and Save an Experiment
This section explains how to enter and save an experiment in the Sim UI.
Tip: Save and refer to this one-page Sim UI Cheatsheet when running an experiment!
3.2.9.1 Start a Play Session in the Sim UI
- From the team Home page, use the Please Select Team Data dropdown to select your team data file, then click GO!

- A Learning Mode pop-up will appear. Make the appropriate selections, then click Continue.

Note: For CC and MM, select your Learning Mode before hitting Play.
- Refer to the Care Coordination (CCParams) or Medication Management (MMParams) tab of the Team Data Table at mtl.how/data, for data regarding the team’s New Patient Start Rates and Return-to-Clinic Visit Intervals.
- To run a simulation for any module within the dashboard, select Play found within each module’s More menu.
Tip: You can learn together if you click Play and join an ongoing session in one of the modules.
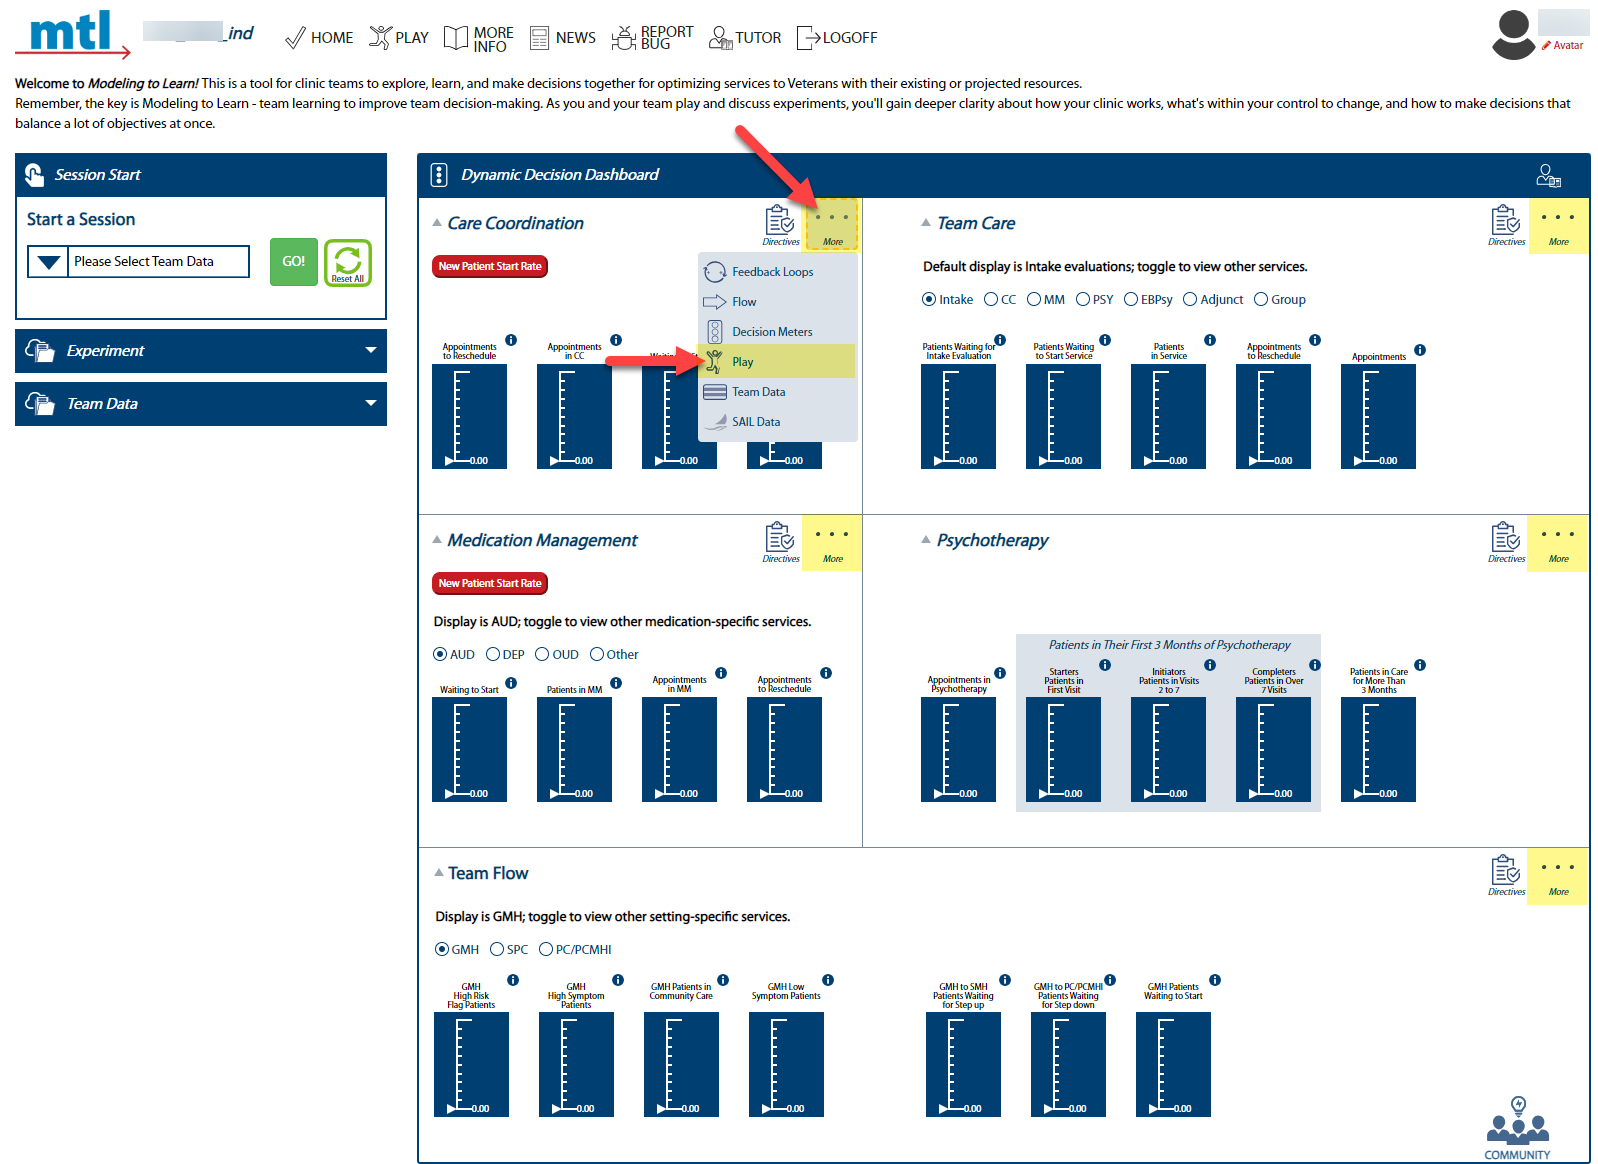
- In the Text pop-up window, populate the Our Question, Our Hypothesis, Our Findings, and Our Decisions text fields.
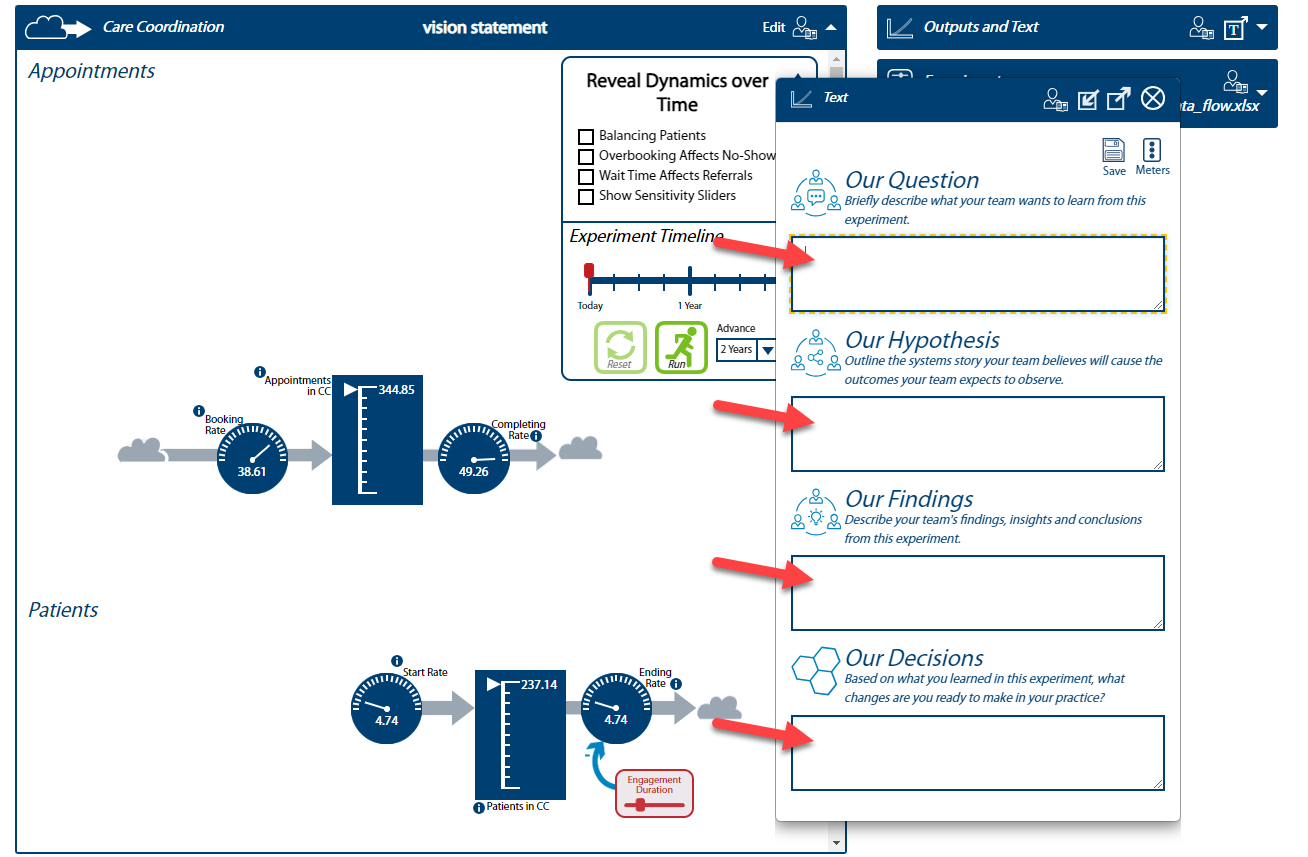
- Click Save. A Save Experiment pop-up will appear. Click the Save icon on this pop-up.
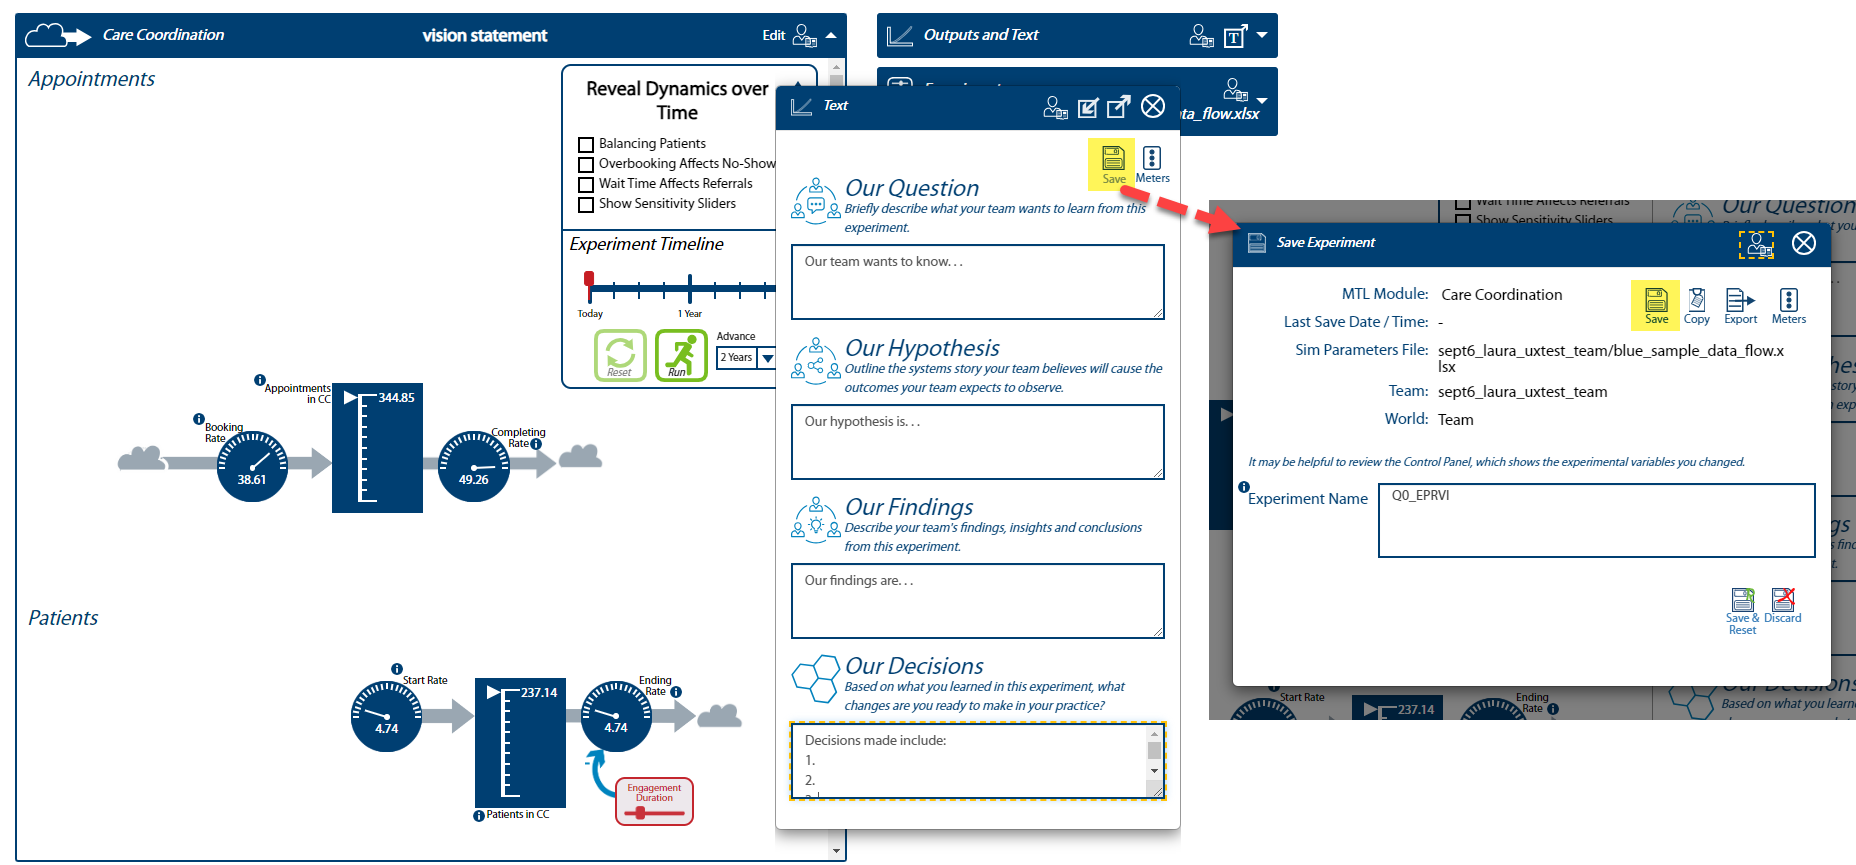
- A Scenario saved successfully message will appear.

3.2.9.2 Orient to the Sim UI
Tip: Refer to the Sim UI cheatsheet to use when running an experiment.
Below is an orientation to the Play Page of the Sim UI.
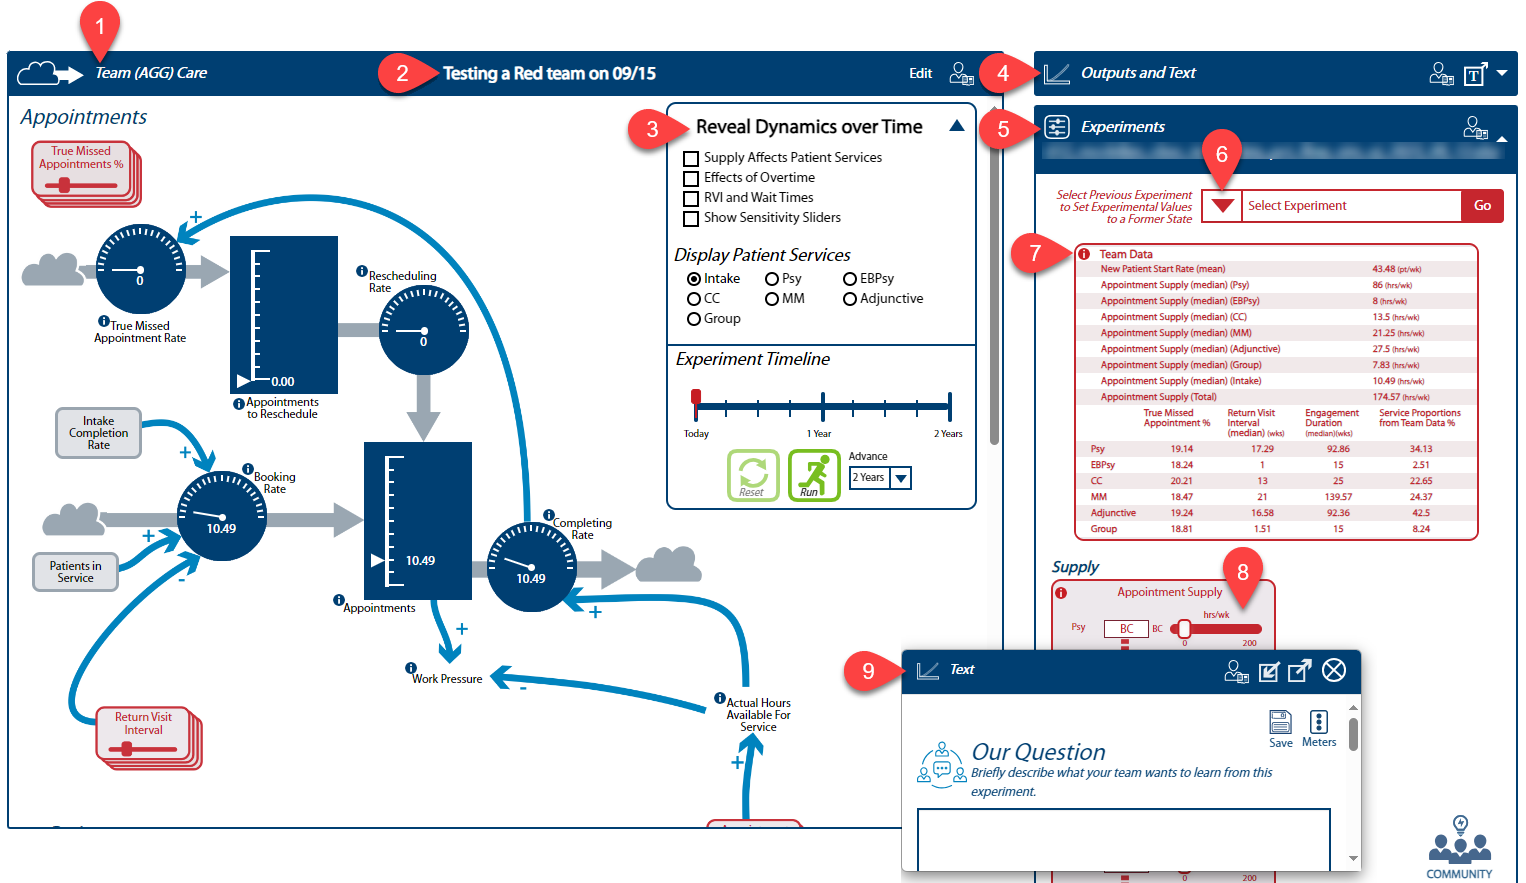
1: Module name.
2: Team Vision.
3: Reveal Dynamics over Time: Reveal more dynamic relationships by clicking the checkboxes. Click Run to simulate outcomes.
4: Outputs & Text: View 6 output charts. Click on expand “T” to open Text (pin #9).
5: Experiments Section.
6: Select previous runs to set experimental sliders and Questions, Hypothesis, Findings, and Decisions (Q/H/F/D) text to that run.
7: Team Data table shows starting values for variables from your data.
8: Move Sliders from initial values and run.
9: Text: Enter Q/H/F/Ds. Click on expand icon in blue bar for full functions.
3.2.10 Resize a Window for Side-by-Side Viewing
- An administrator may need to show two items on the screen side-by-side for comparison. Field users may also want to view two items on the screen for comparison or reference.
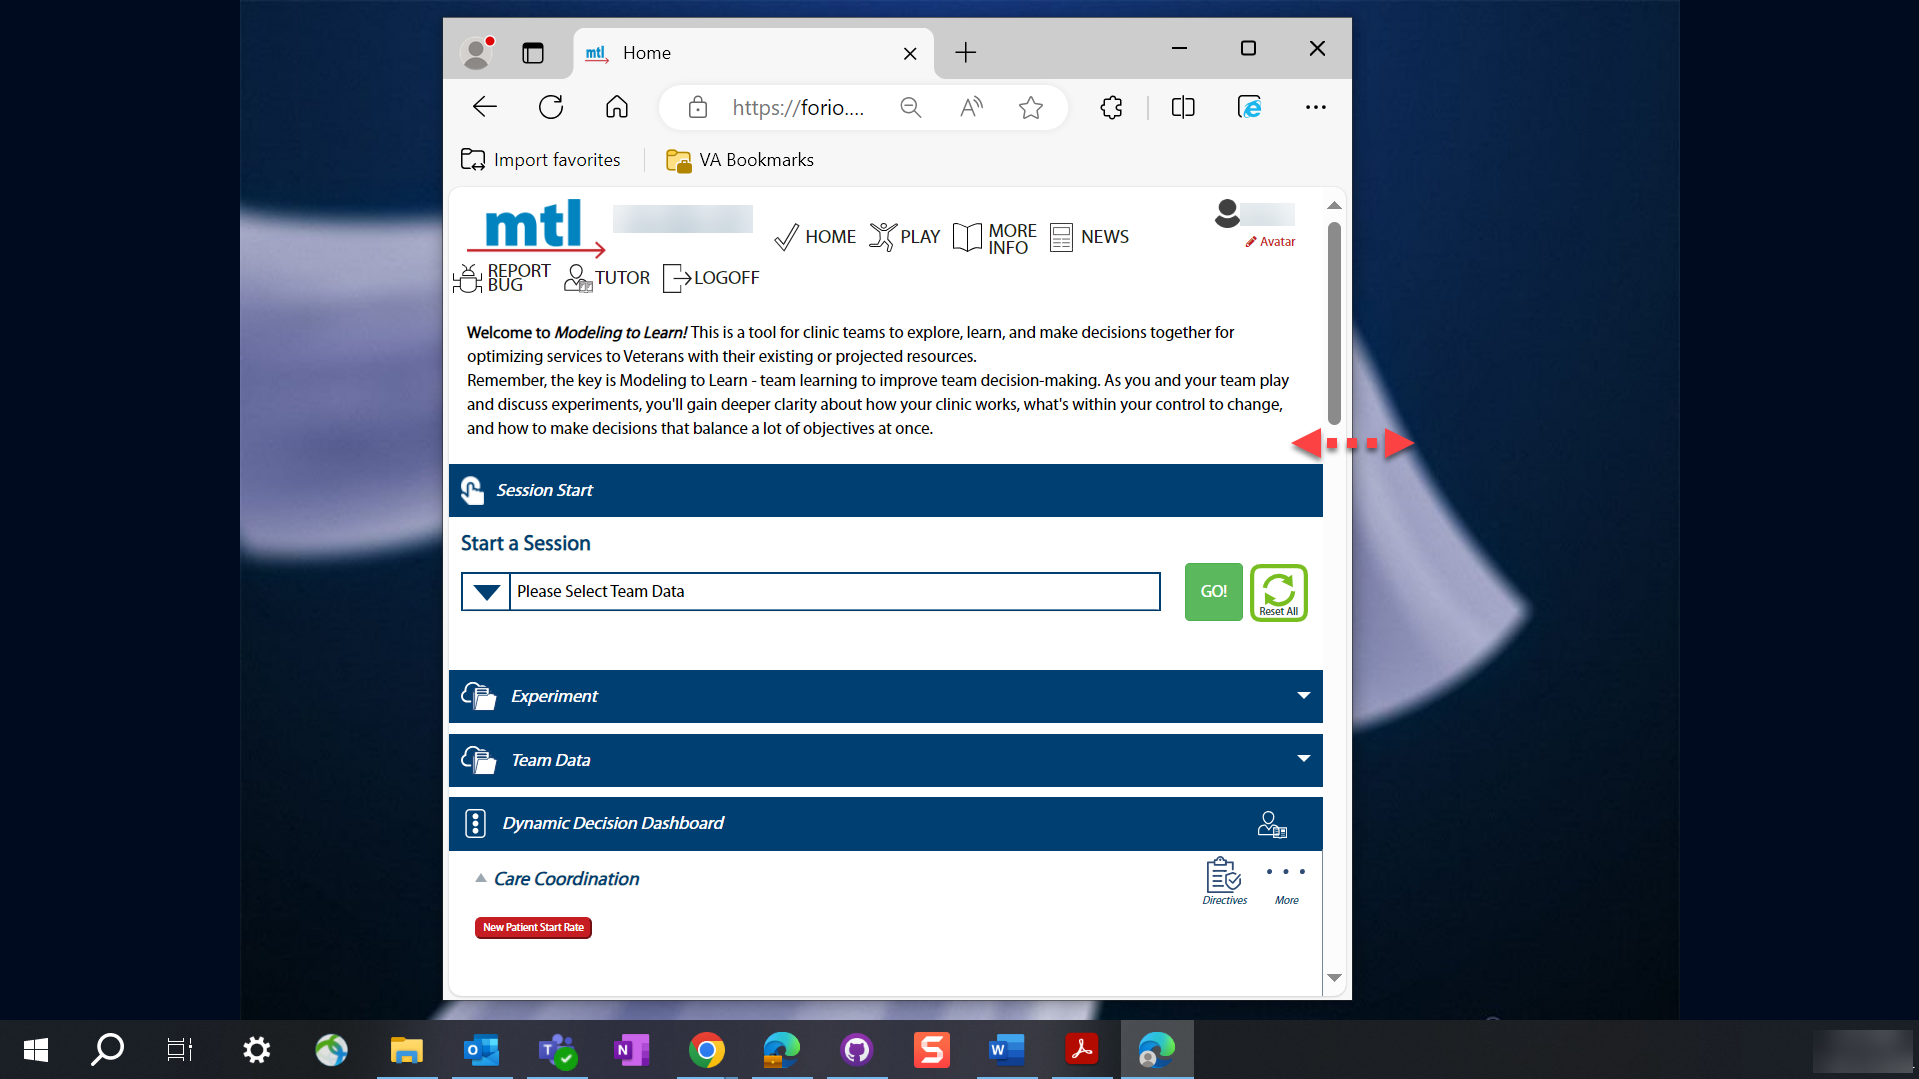
- The Sim UI has a responsive design that should accommodate many resolutions and browser window sizes.
- Follow the steps below to get the best view.
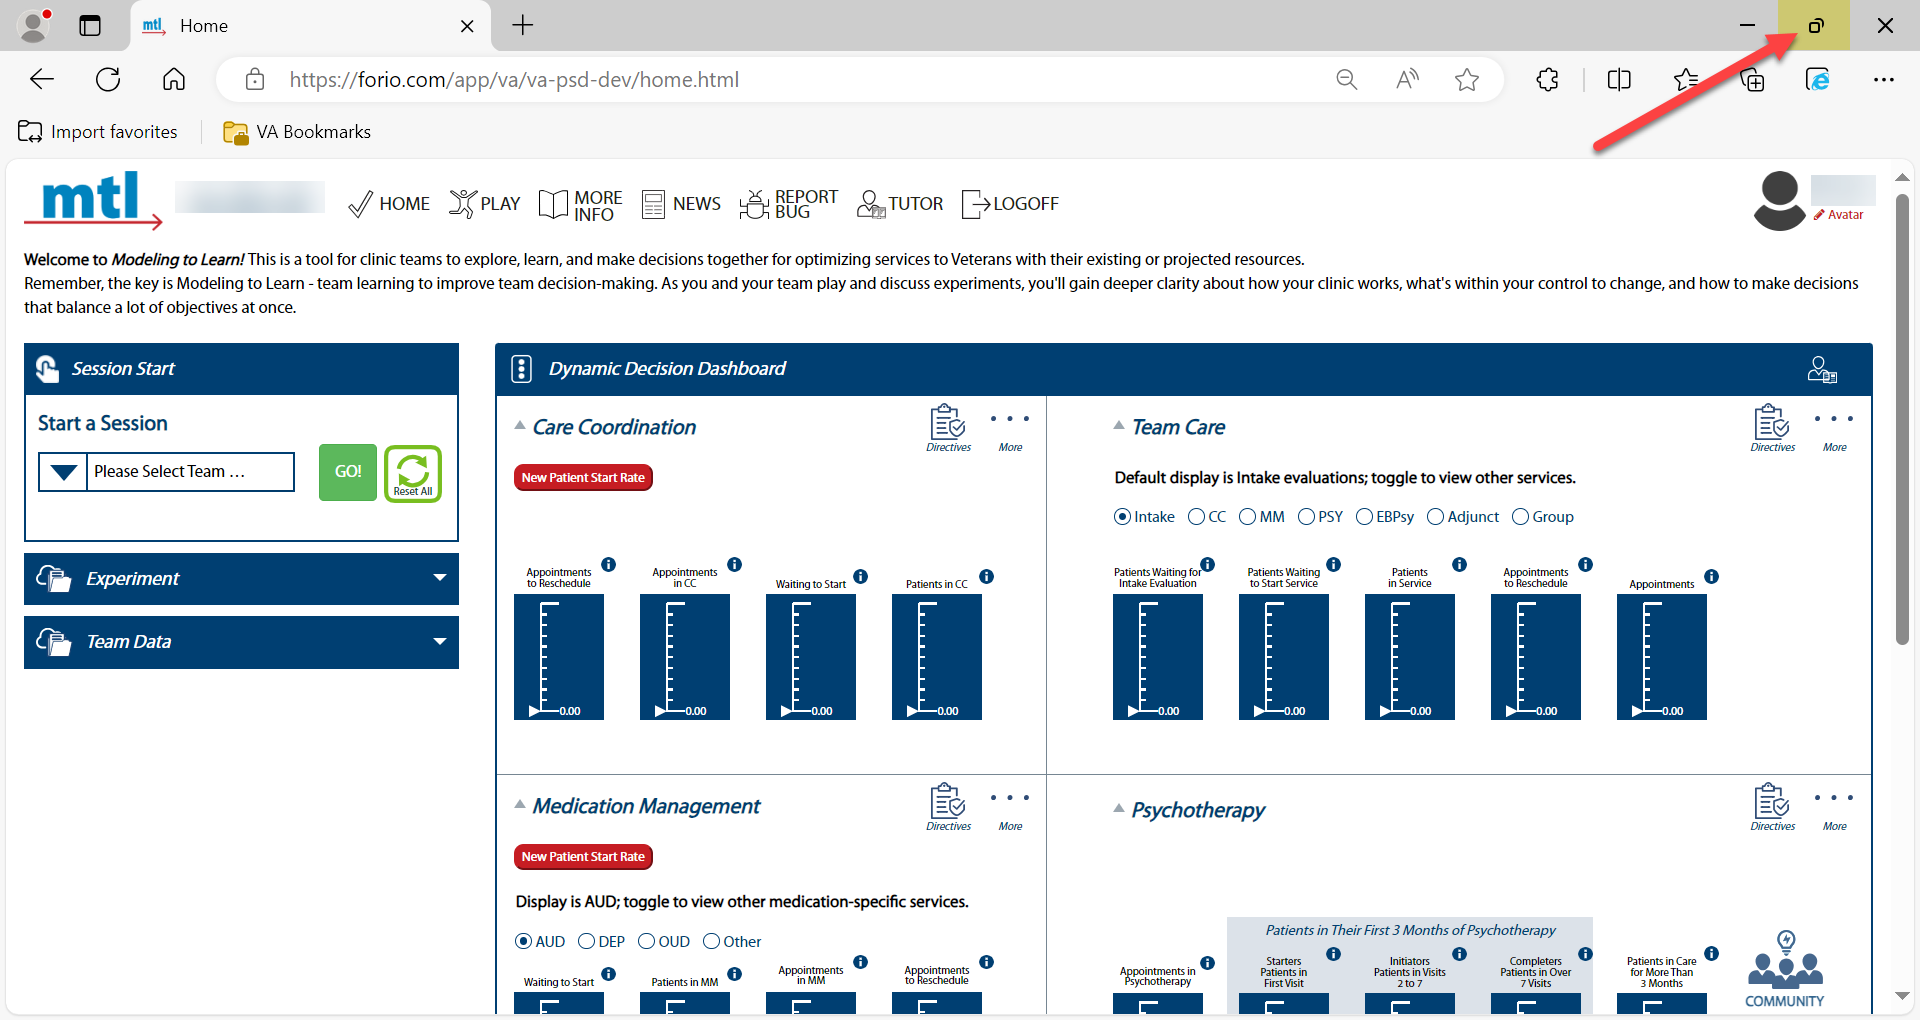
- Click the “window” icon in the upper right of the browser window.
- Drag the browser window to the desired size. Notice how the Sim UI design responds by stacking top navigation menu icons and other page contents.
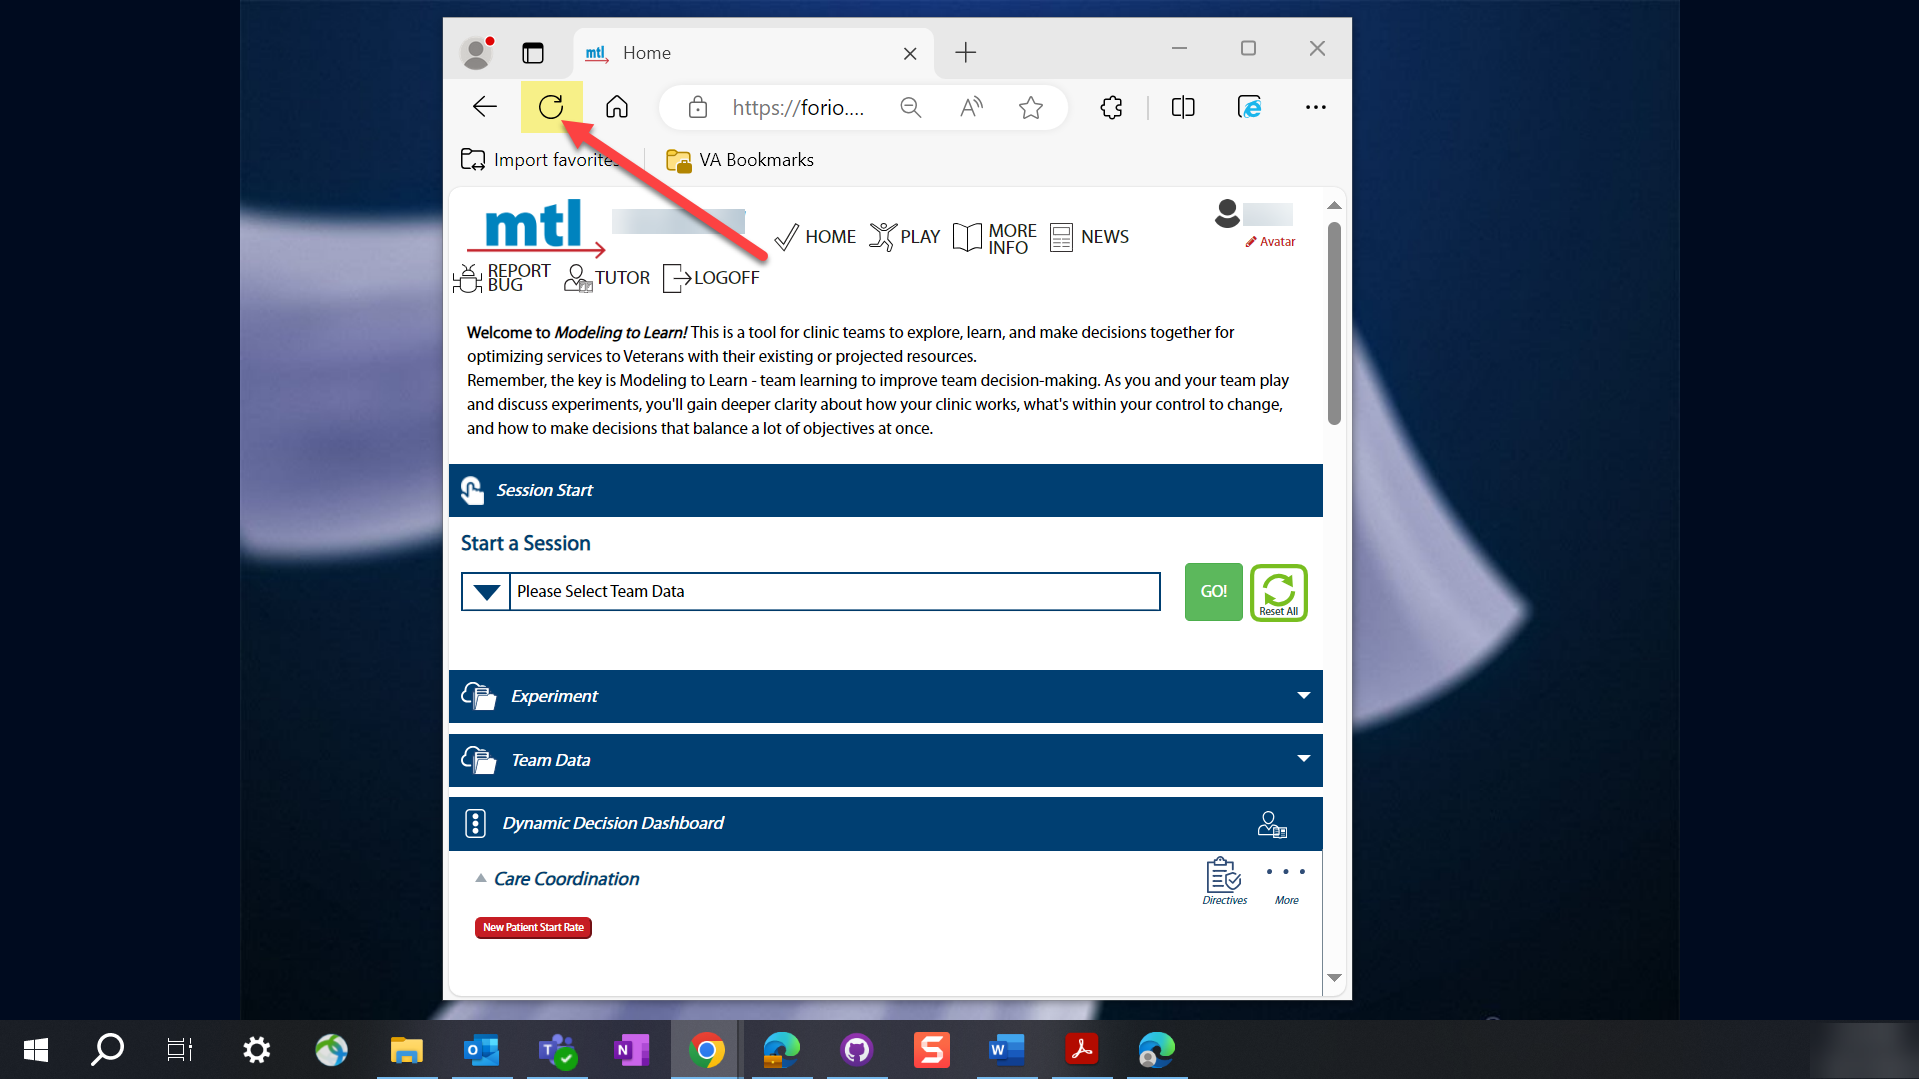
- Sometimes items on the screen are cutoff or not formatted correctly. Click the refresh button so the browser can detect the new window size and adjust the format.
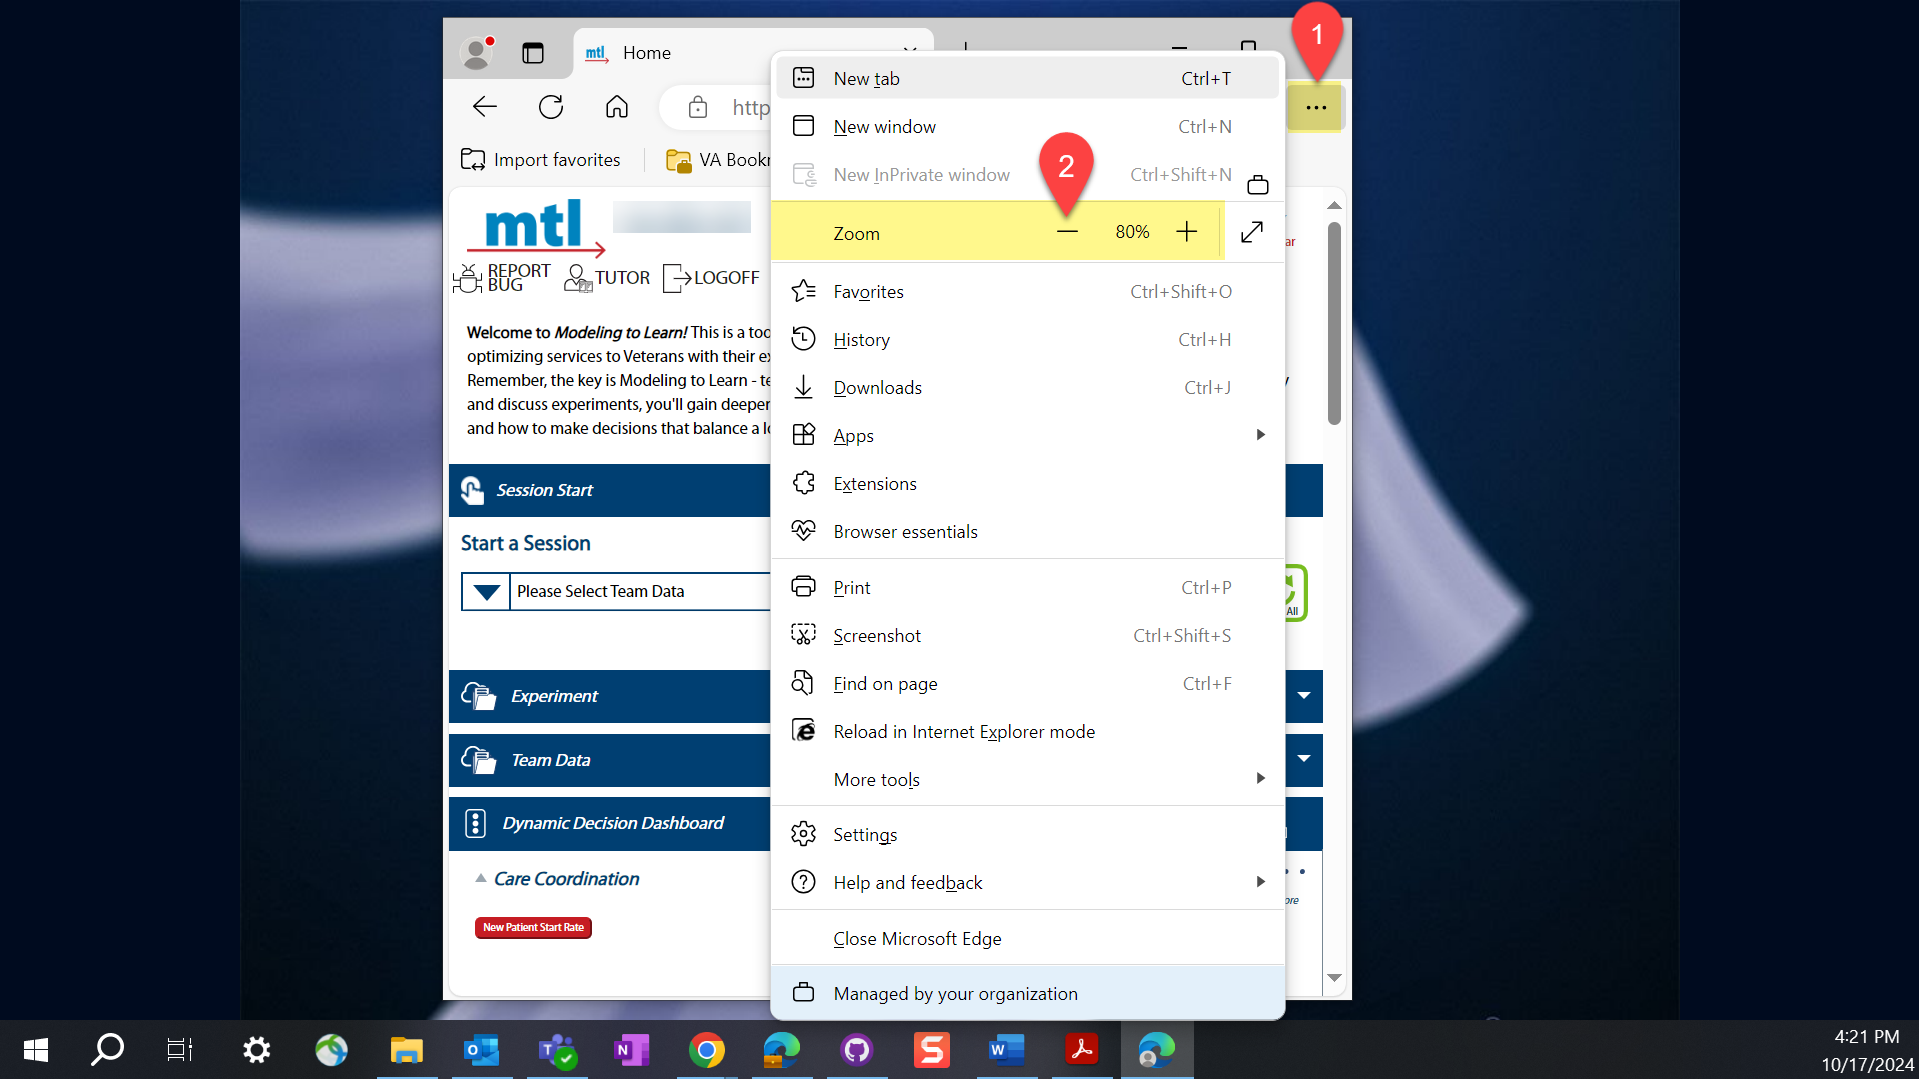
- If the format is still not optimum, decrease the zoom below 100% to reduce the size of the items on the screen, or drag the screen slightly larger.
3.2.11 Report a Bug
- There are two ways to report a bug; through the Sim UI and directly through GitHub.
- One must have access to either the Sim UI or GitHub in order to report a bug.
3.2.11.1 Report a Bug through the Sim UI
- From the Home page or from the Play page, click on the Report Bug icon.
![]()
- Describe the issue in the field provided (please be detailed as possible). Do not include PII or other Site identifiable information. Instead, use generic language. If you have a screenshot you want to share, click the checkbox.

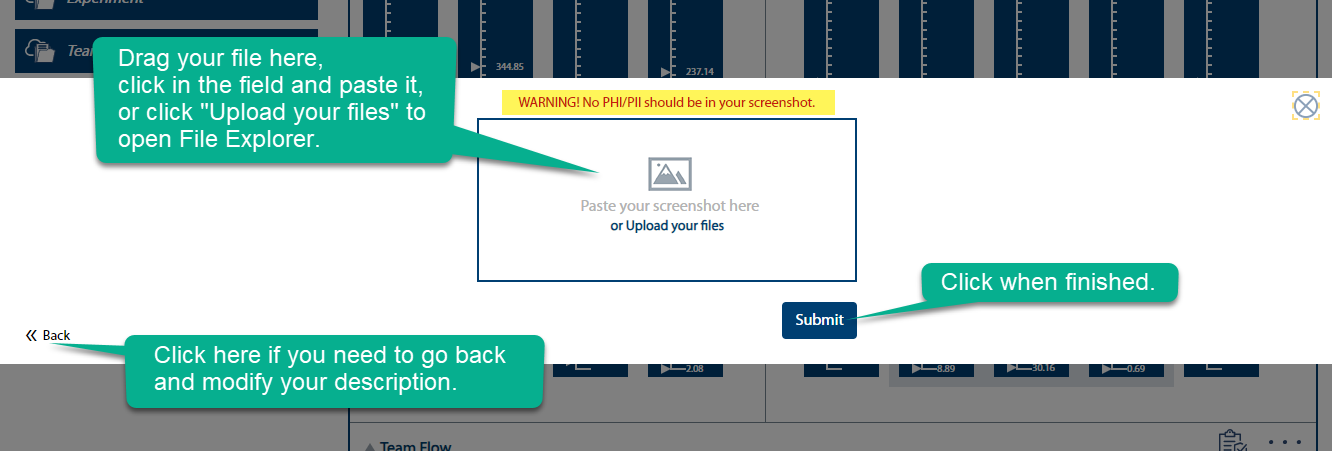
- Click Submit when finished. If you clicked the screenshot checkbox, an additional dialogue will appear to help you upload your picture. Be sure there are no PII in the screenshot! Click Submit again when finished. The Sim UI will report the bug automatically to GitHub.
3.2.11.2 Report a Bug Directly in GitHub
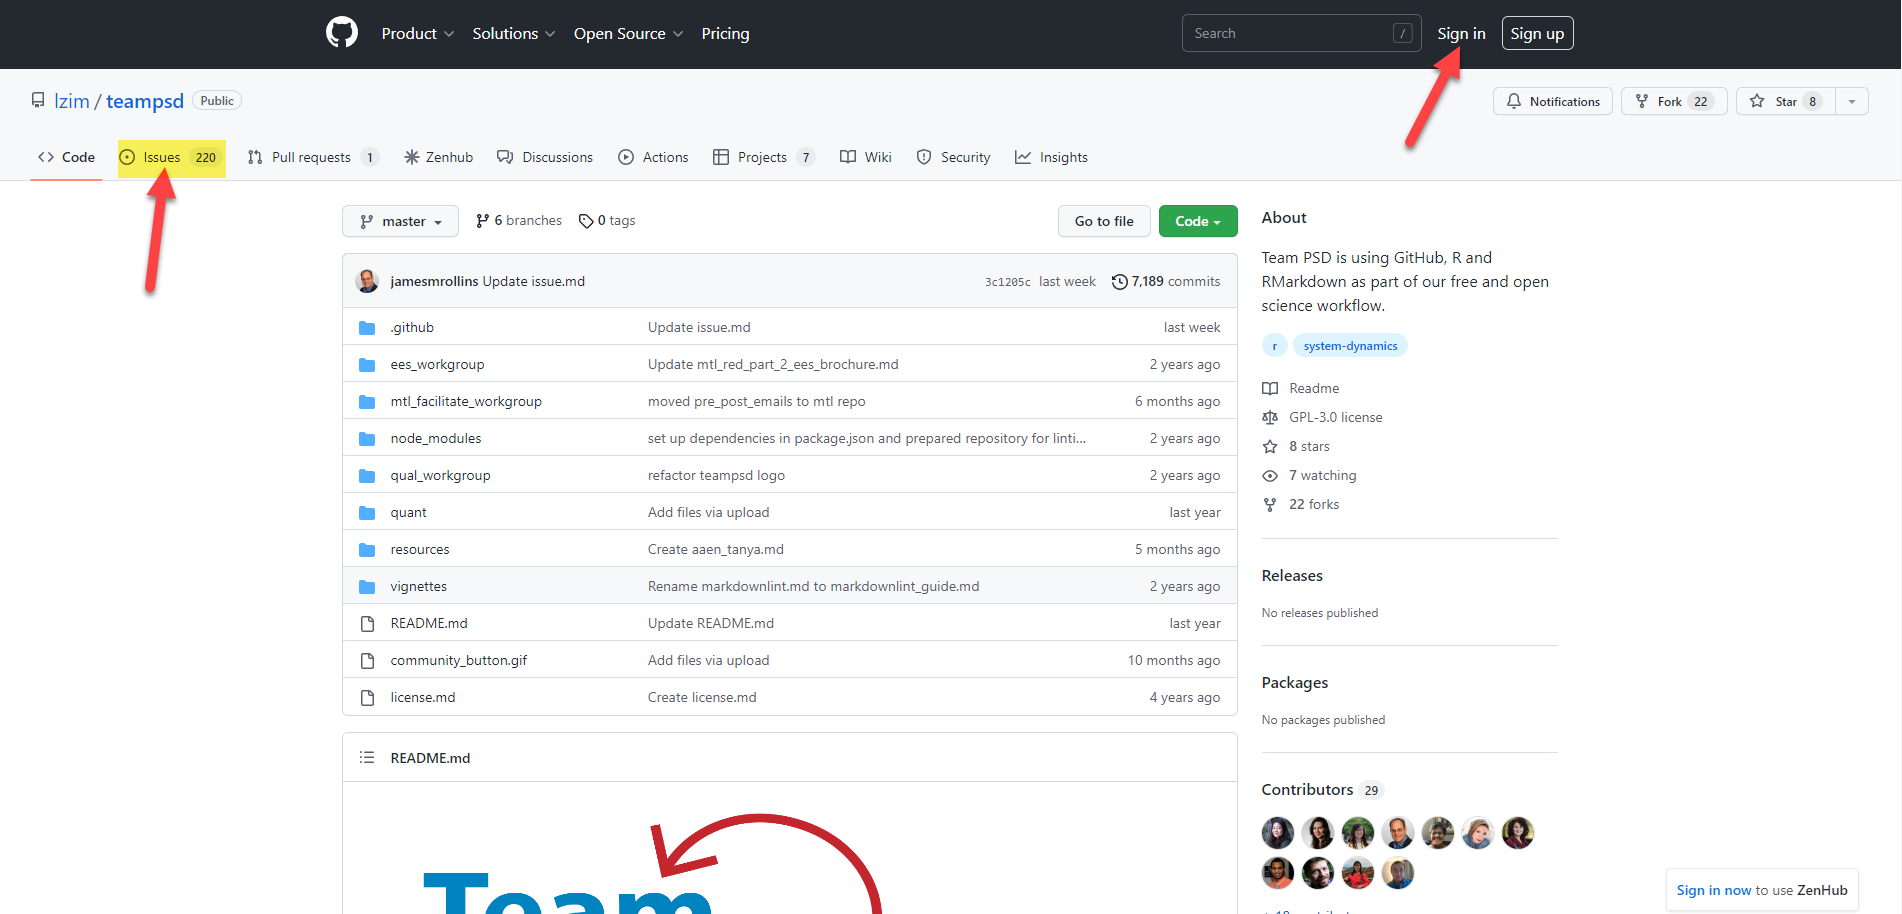
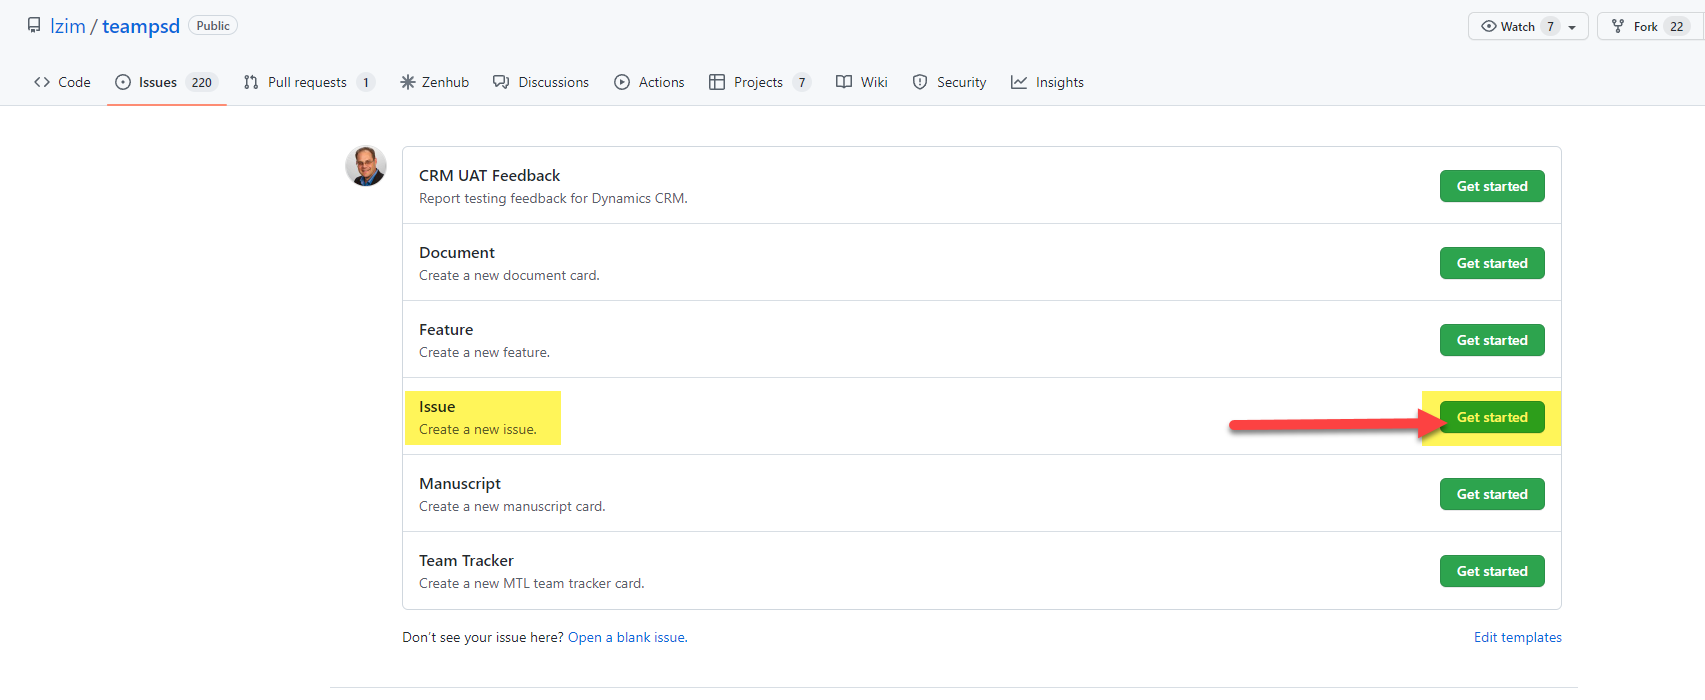
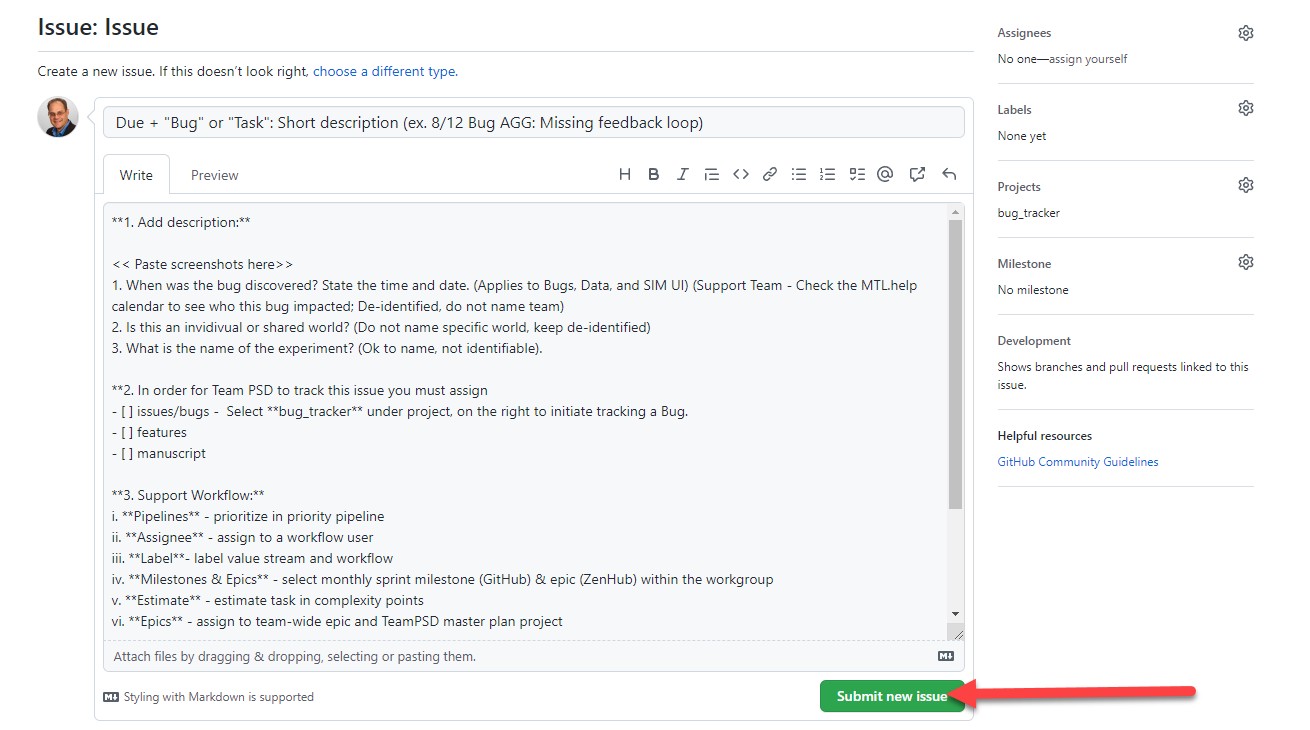
- To report a bug directly in GitHub, navigate to mtl.how/teampsd to get started. The page below should appear. If not signed in, sign in. Then click the Issues tab.
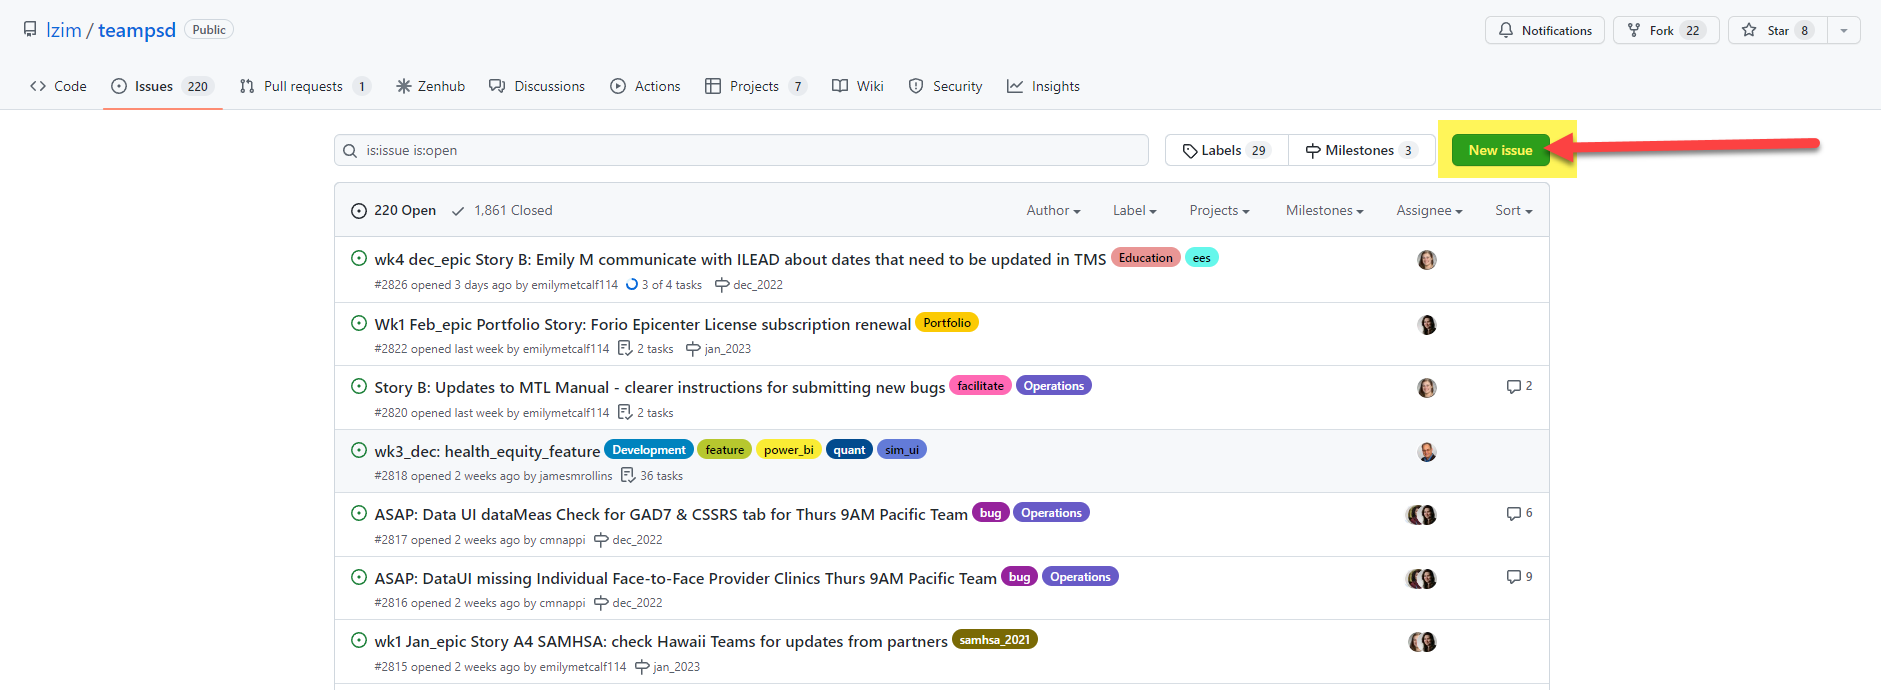
- Click “New Issue” button.
- Click “Get Started” in the “Issue” swim lane.
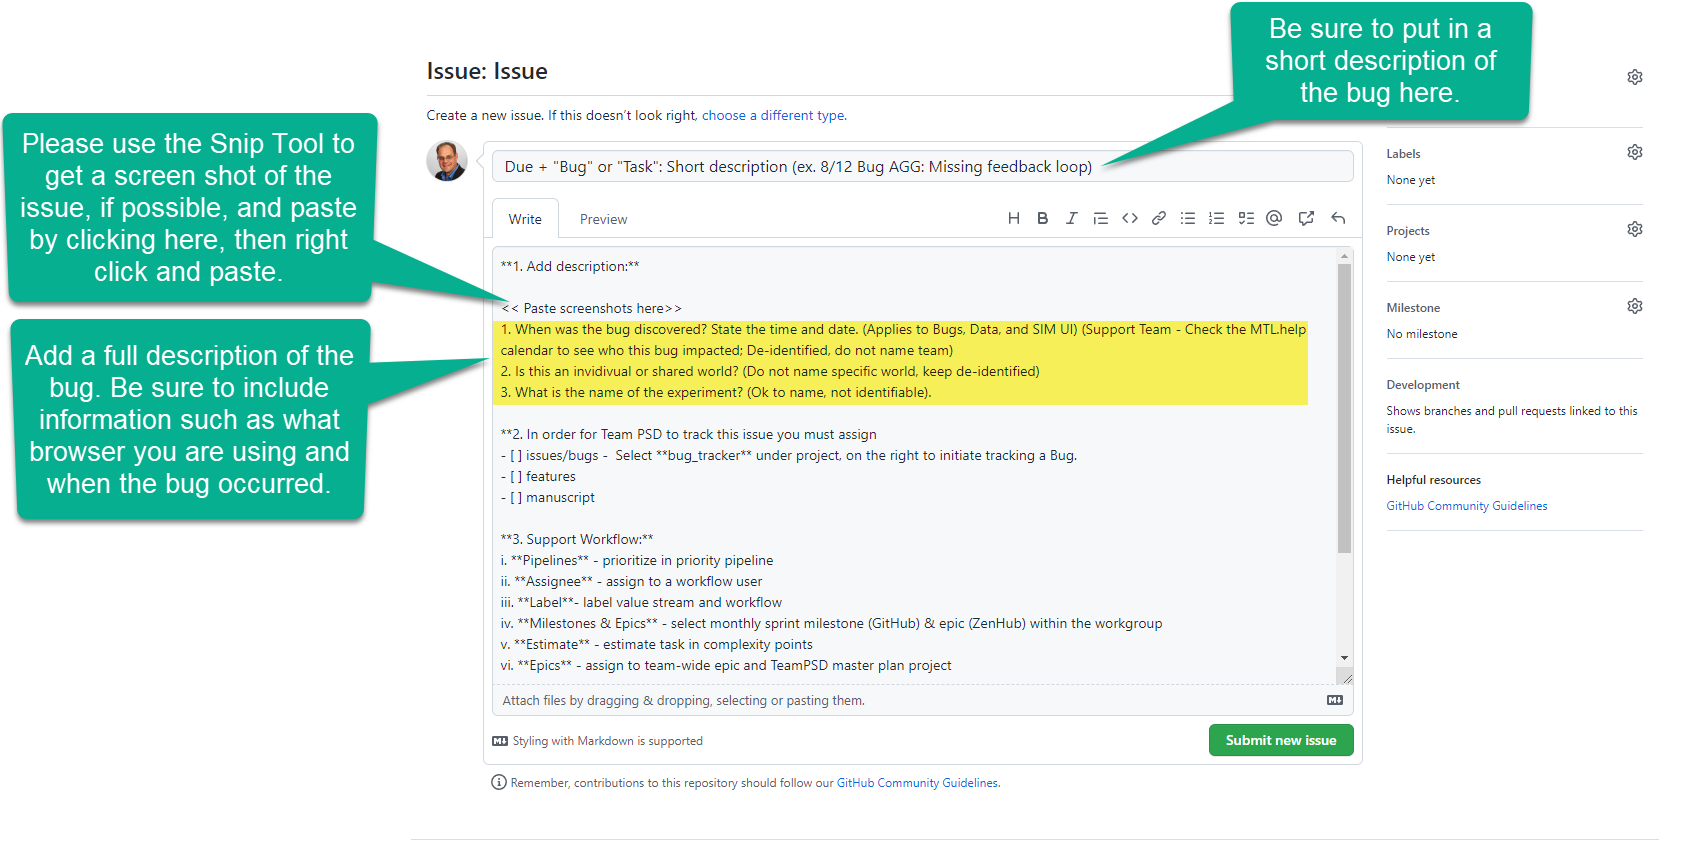
- Complete the Issue Form. Do not include PII or other Site identifiable information. Instead, use generic language.
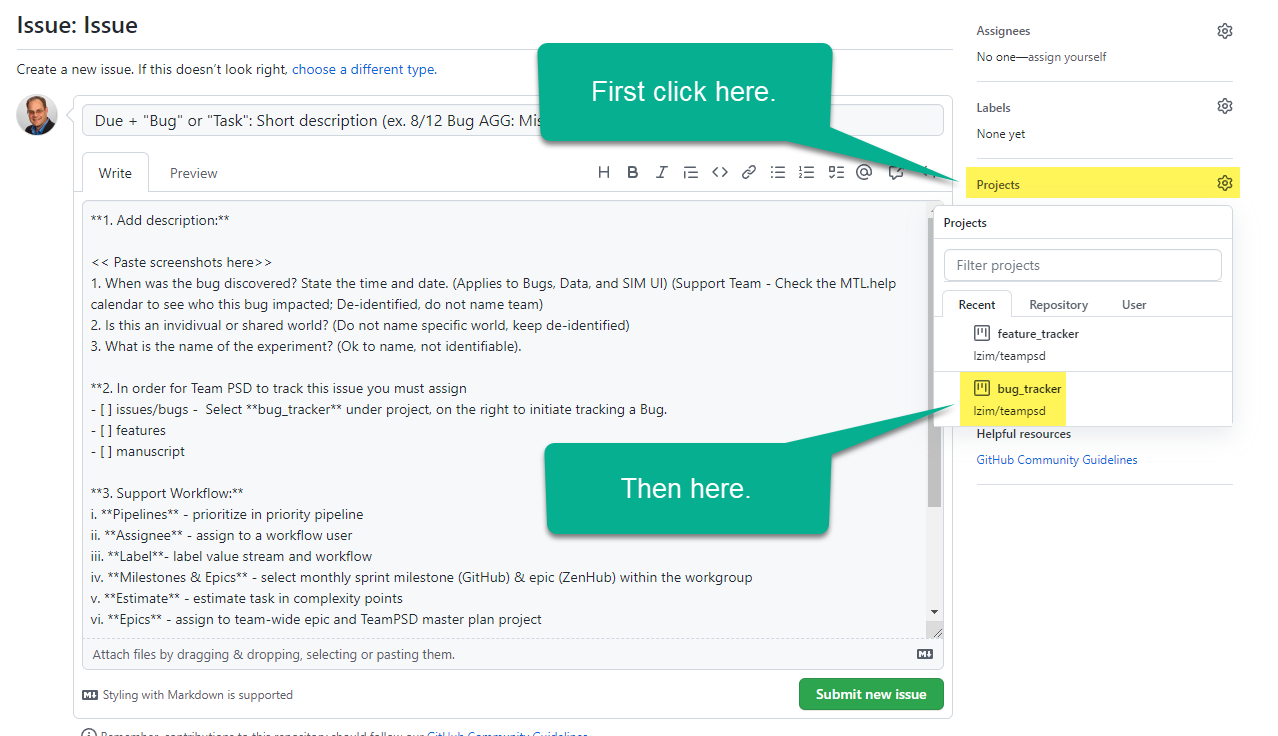
- Route the form to the “bug_tracker” project for action by Team PSD. Be sure to check the “bug_tracker” is listed under “Projects” (see the second screenshot below).
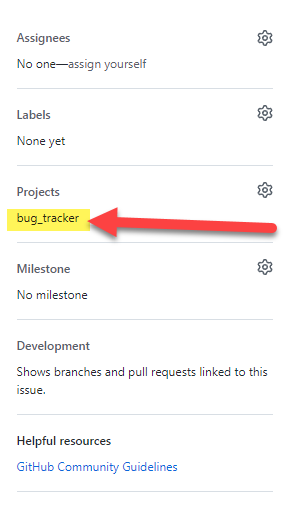
- Click the “Submit new issue” button.
3.3 Administrator Technical Manual
As a MTL Administrator, the following chapters will help answer any technical questions you may have during prep and live team meetings.
3.3.1 Login as Administrator
- Navigate to mtl.how/sim.
- Log in using your credentials and select the administrator_login world. The Sim UI Administrator Dashboard will appear.
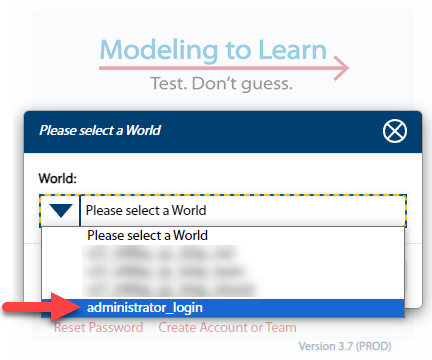
Note: For Administrators, the login dropdown only shows worlds in which you’re a Team Lead or Member (not Administrator).
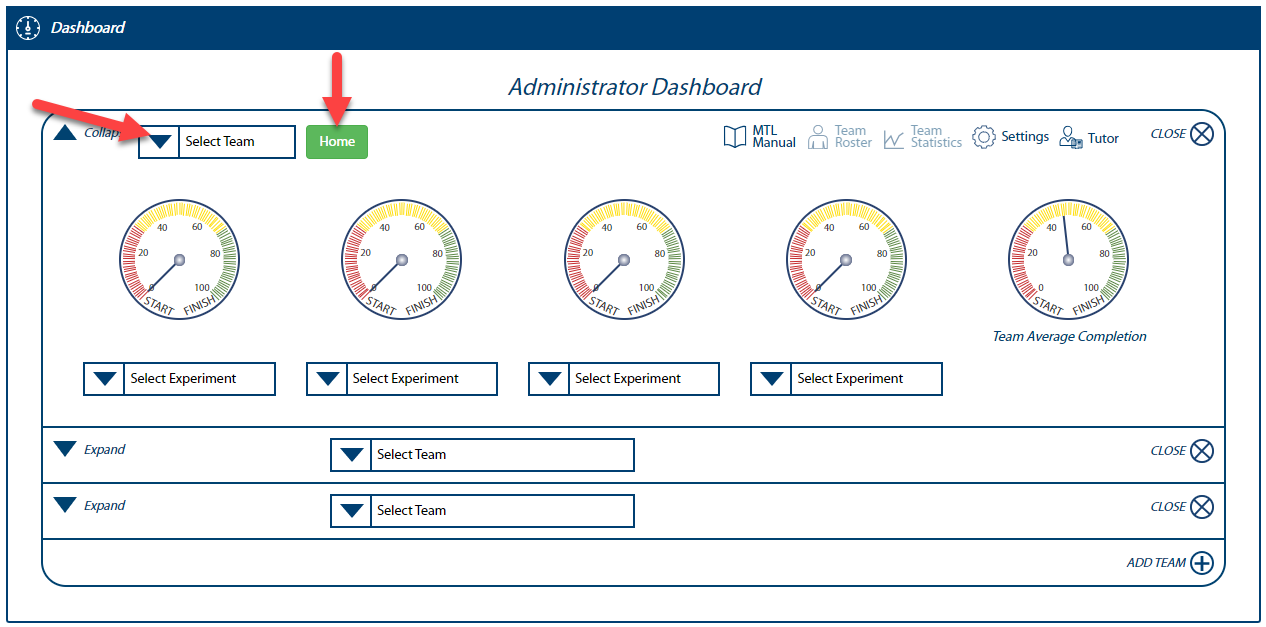
3.3.2 Sim UI Administrator Dashboard
This section provides familiarization with the Administrator Dashboard and explains how to use this dashboard to set up and manage teams. If you have the Administrator role in any team and have been added into the “administrator_login” in Epicenter, you will be allowed to login using the “administrator_login” dropdown choice.
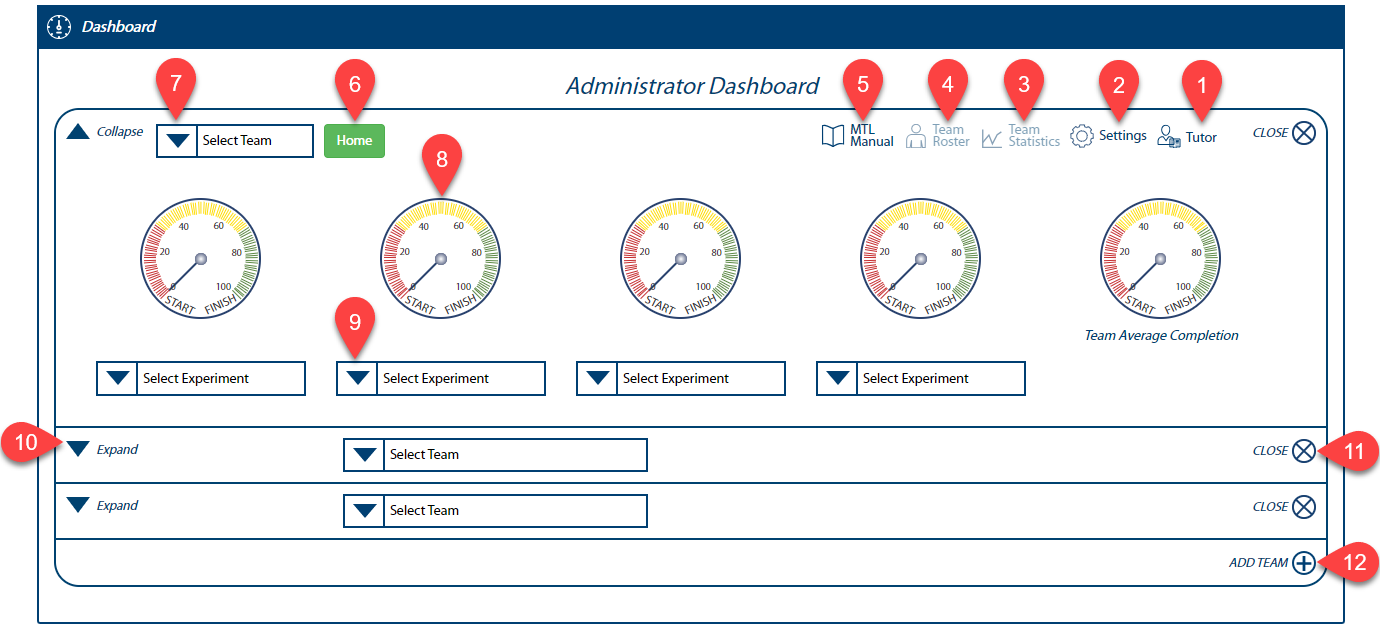
Tutor - Click for a guided tour of page features.
Settings - Click to set up a team. It provides team setup input screens and a means to load Team Data. See the Manage Teams section for more information.
Team Statistics - Lists experiments, when they started and ended, total time-on-task, team size, attendance percentage, and completion percentage.
Team Roster - Lists team members, their clinical role, and team role.
MTL Manual - Click to open a comprehensive program and technical guide about Modeling to Learn.
Home - Click to go to the selected team’s Home page, which also contains the Dynamic Decision Dashboard.
Select Team - Use this dropdown to select your desired team. It enables you to monitor their experiments and navigate to the team’s Home page. FYI: This dropdown only shows groups to which you belong (not ones in which you have the Administrator role).
Gauges - This indicates the team’s progress with a selected experiment. Teams receive 20% completion for a minimum 50 characters input for each of the Question, Hypothesis, Findings, Decisions fields and another 20% for running the experiment.
Select Experiment - Use this dropdown to select the desired experiment to monitor. An experiment will not show in this dropdown until it has been named and saved.
Expand / Collapse Dropdown Triangle - Manage and monitor multiple teams by selecting this dropdown.
CLOSE - Click to de-select a team.
ADD TEAM - Click to add an unlimited number of teams to the dashboard.
3.3.3 Manage Teams
This section describes how to set up a team from the Administrator Dashboard. Once team setup is complete, users can access the team’s Home page which contains the Dynamic Decision Dashboard.
Note: Do not add non-Admin users during team setup. Non-Admin users must self-register to join teams.
- Click the Settings icon to begin setting up a team.
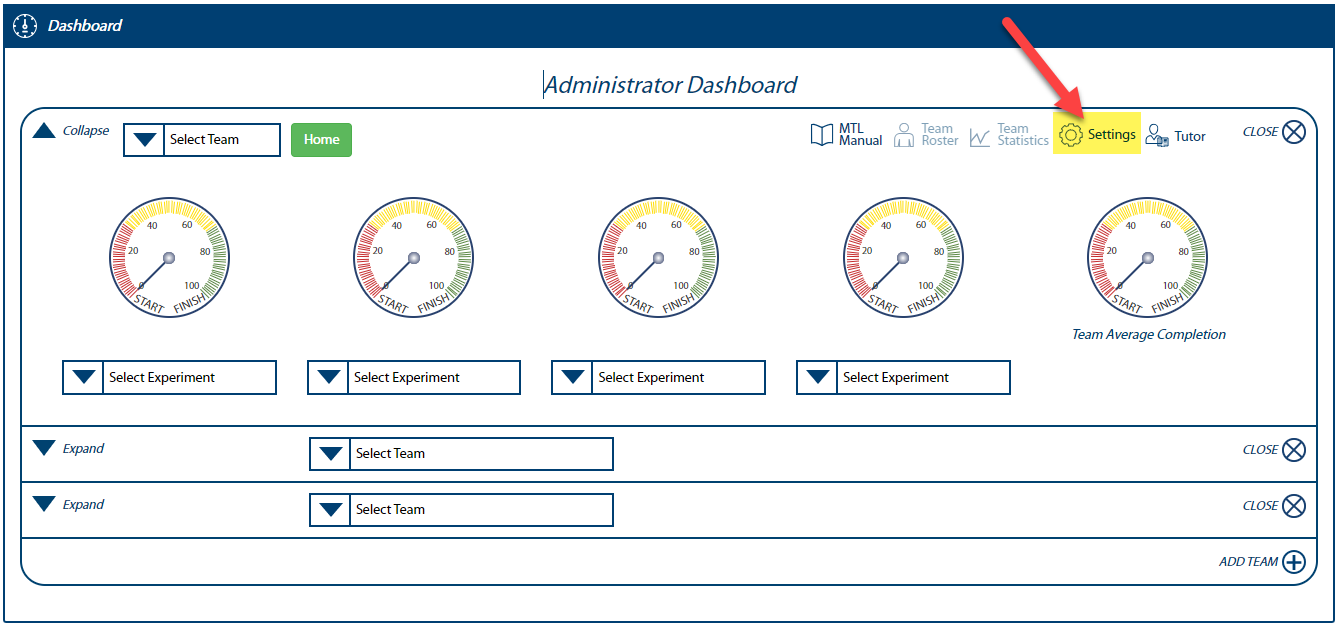
Within the Facility Team Setup area of this pop-up, several team setup options are available and are described below:
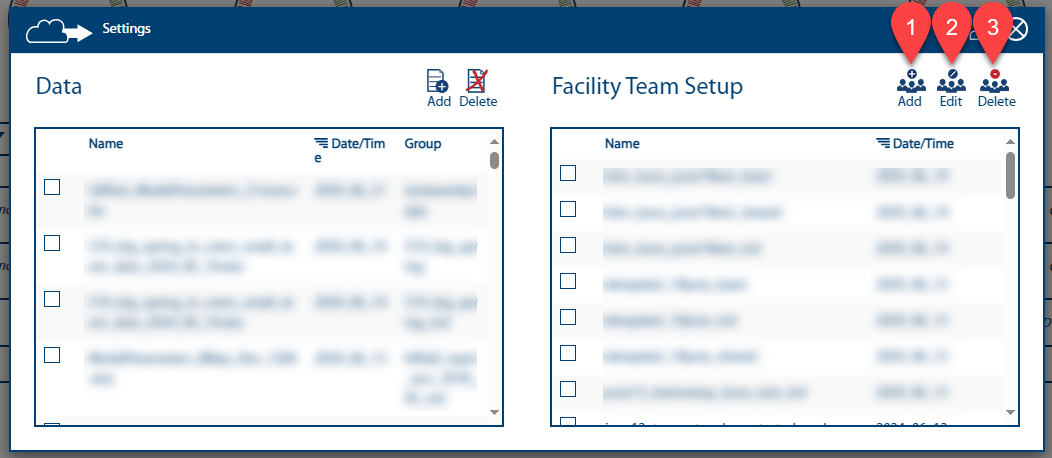
Add - Click to add a team.
Edit - Select a team first, then click here to edit that team.
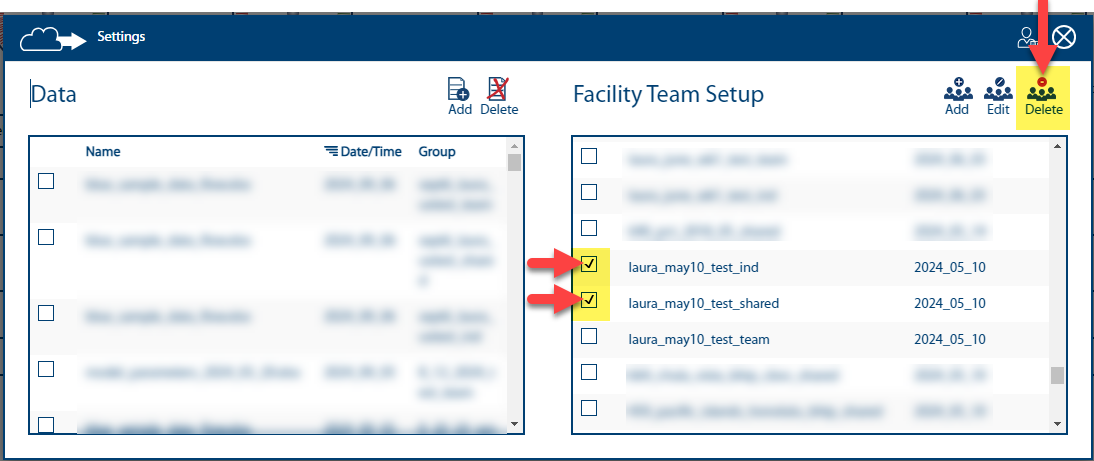
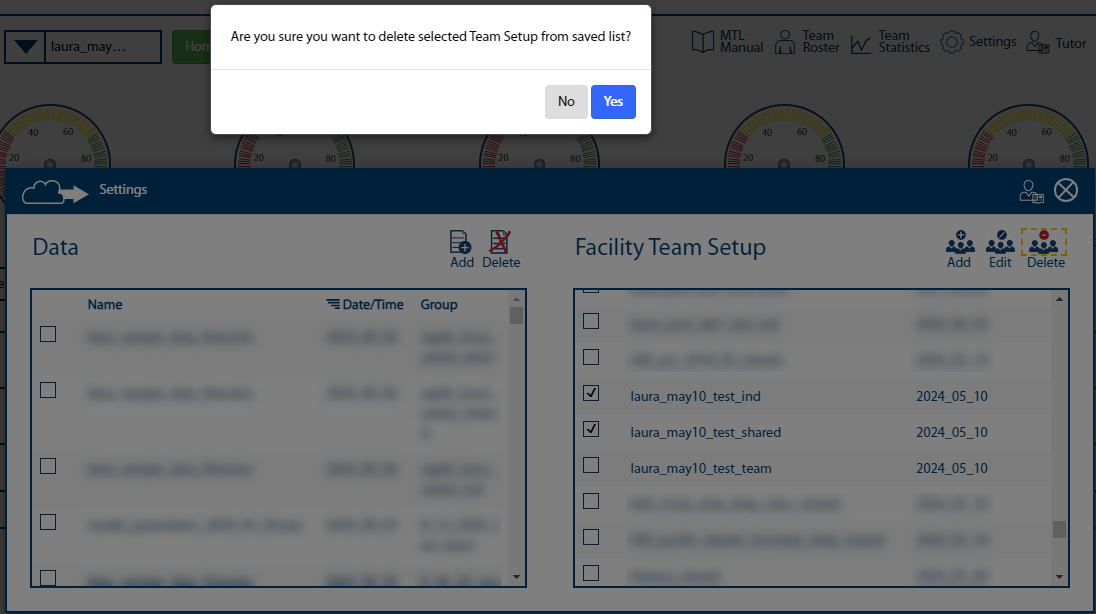
Delete - Select a team first, then click here to delete that team.
Note: Teams shown under Facility Team Setup are ones you have joined and in which you have the ‘Administrator’ role. Teams in which you have ‘Lead’ and ‘Member’ permissions will not be visible.
3.3.3.1 Add a Team
- Click the Add icon. A Setup pop-up will appear.
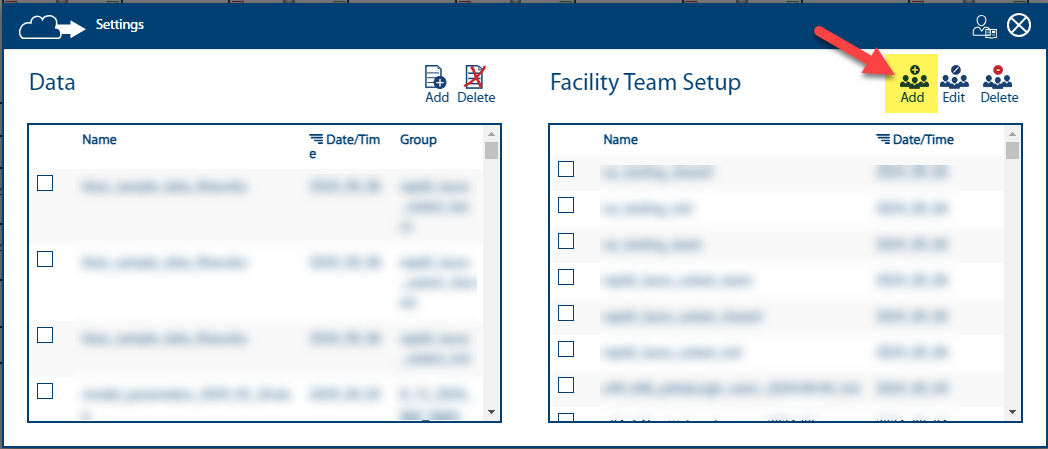
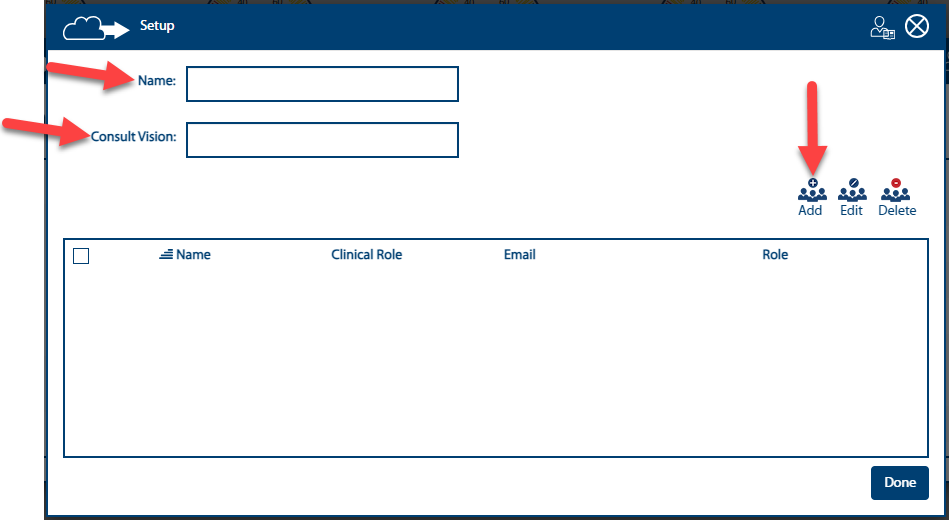
- Add the team name using the convention “visn_facility_clinic_facility team name”.
Just add the team’s root name. The setup function will automatically add “_team”, “_ind”, and “_shared” extensions in Epicenter.
Use only lowercase letters.
Use the underscore (_) character instead of spaces.
Add the team’s consult vision. This field is required.
Click the Add icon to add a team member. A Setup - Add Members pop-up will appear.
Reminder: Do not add non-Admin users during team setup. Non-Admin users must self-register to join teams.
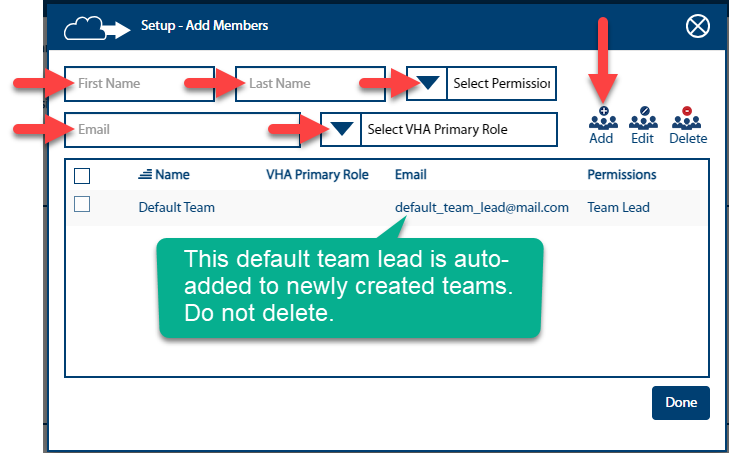
Enter First Name, Last Name, and Email.
Use the Select Permissions dropdown to assign the team member’s permission level on the team.
Use the Select VHA Primary Role dropdown to assign the team member’s role on the team.
Click the Add icon.
Note: Click the checkbox next to a name and then select Edit or Delete to update information or delete a team member.
- Click the Done button when finished.
Notes:
- If your newly created team (and its associated worlds) do not show in the Administrator Dashboard’s Select Team dropdown, reload the page.
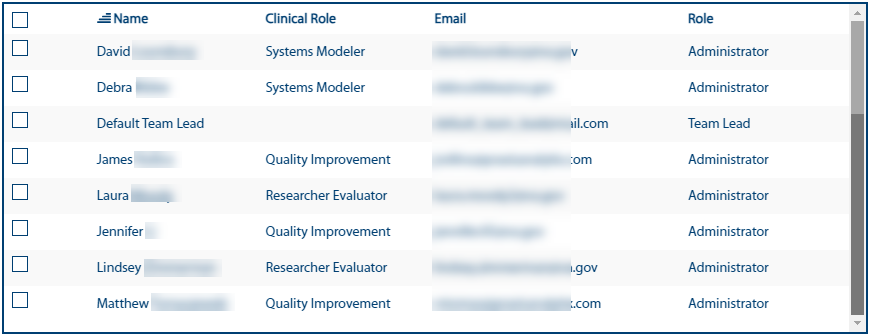
- The Sim auto-adds members of our internal team as administrators to newly created teams. This is in addition to the default team lead. Keep the auto-added individuals shown below as-is.
3.3.3.2 Edit a Team
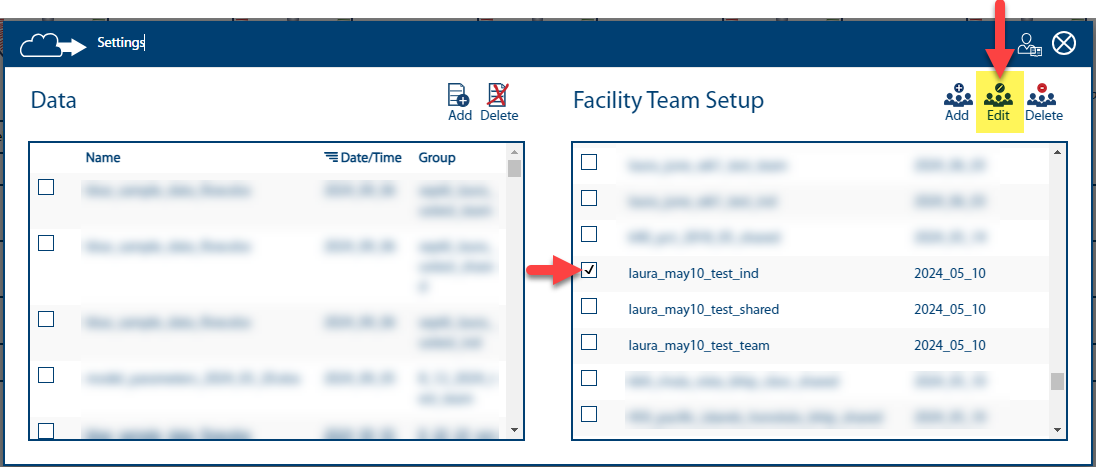
- Click the checkbox next to the team you want to edit, then click the Edit icon. An Edit Setup screen will appear.
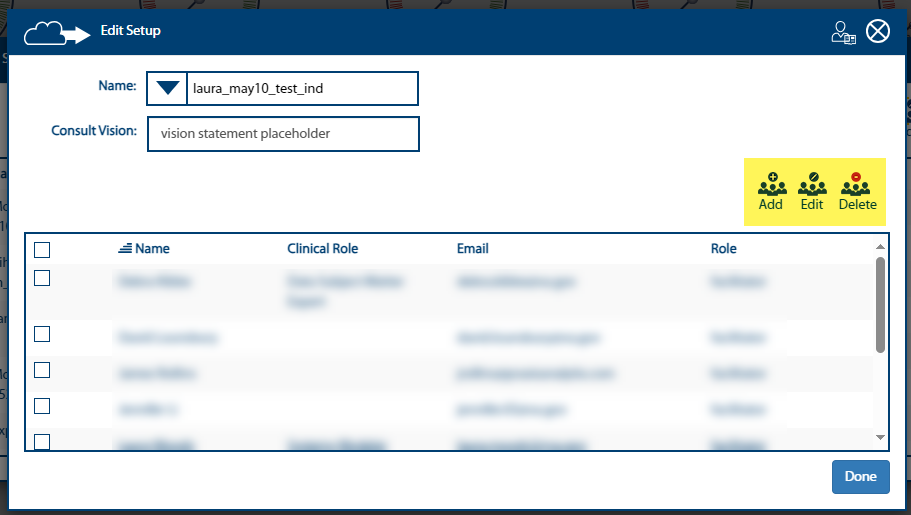
- Within the Edit Setup screen, you may add, edit, or delete team members from your selected team.
2a. To add a new team member, click the Add icon. A Setup - Add Members pop-up will appear.
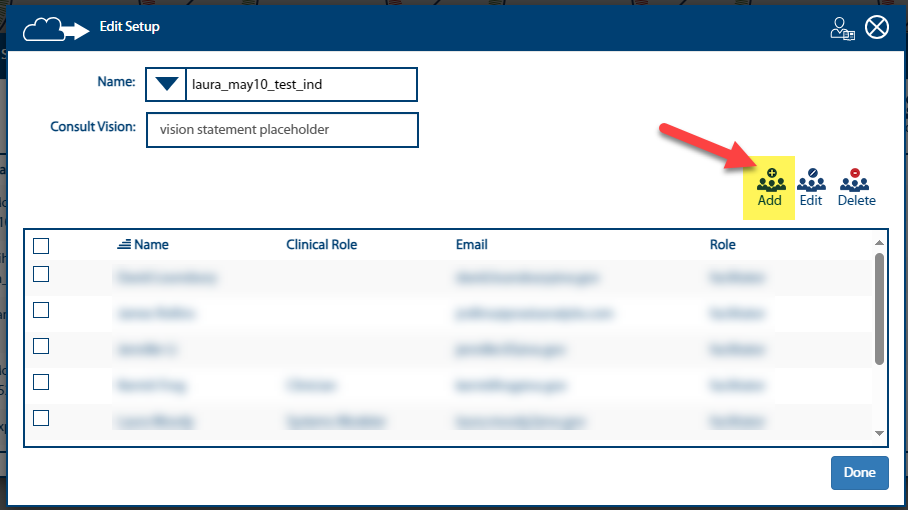
- Enter First Name, Last Name, and Email. Use the Select Permissions dropdown to assign the team member’s permission level on the team. Use the Select VHA Primary Role dropdown to assign the team member’s role on the team, then click the Add icon.

Notes:
- Adding a member to _team will automatically add them to _shared and _ind.
- Adding a member to _shared will not impact _ind or _team.
- Adding a member to _ind will not impact _team or _shared.
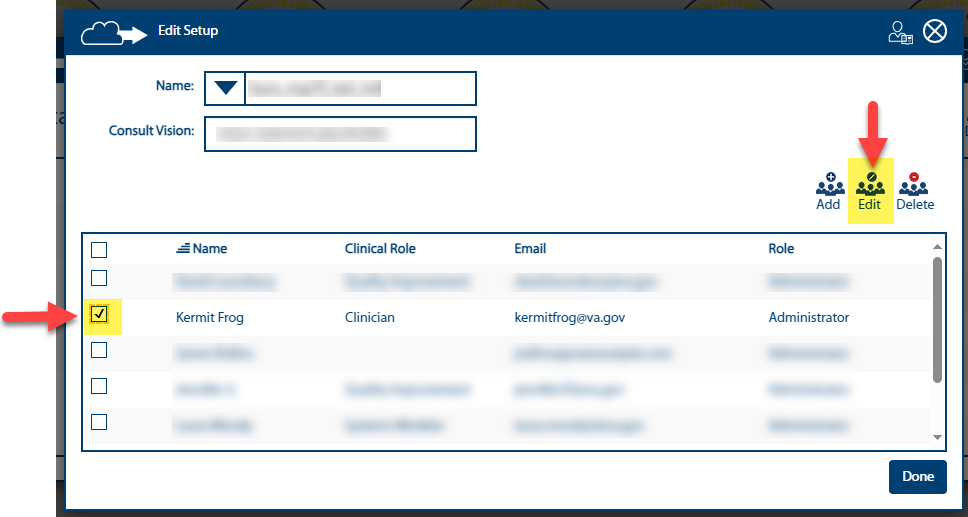
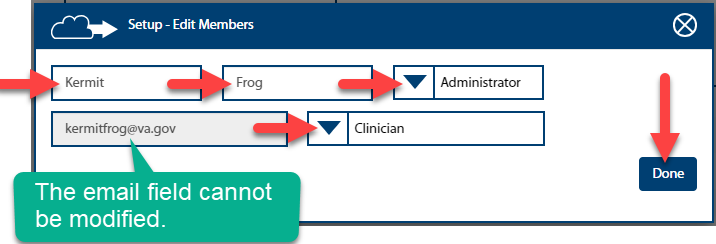
2b. To edit a team member’s information, select the checkbox next to the team member’s name, then click Edit. A Setup - Edit Members screen will appear.
- Make changes as needed to the First Name, Last Name, Permissions, and/or VHA Primary Role fields.
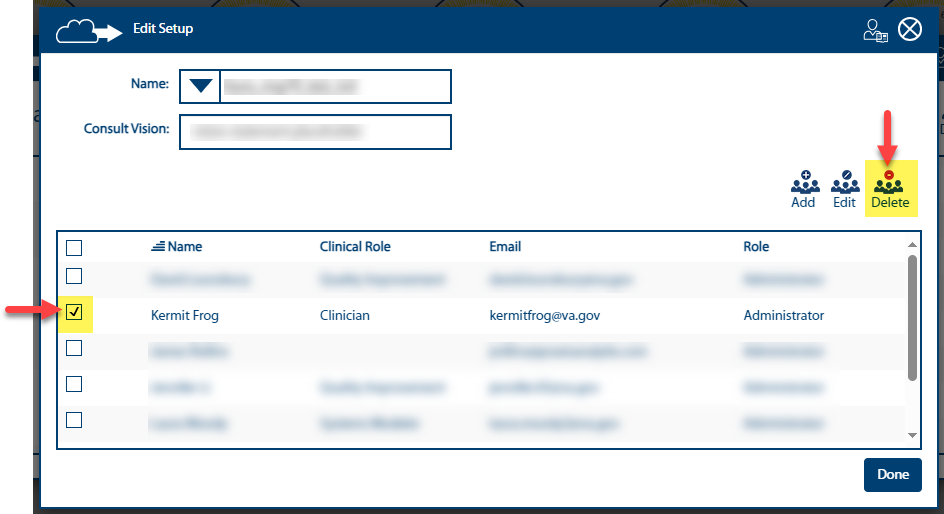
2c. To delete team members, select the checkbox(es) next to the team member(s) you want to remove from the team, then click Delete.
Note: More than one team member can be deleted at a time.
- A confirmation message will appear; select No if you wish to make further changes, select Yes to confirm deletion of selected team member(s).

- Click Done when finished editing your team(s).
3.3.4 Manage Team Data
Field users maintain data file(s) from their team’s Home page and should refer to the Dynamic Decision Dashboard section to do so. Administrators and the internal team can manage data file(s) from a team’s Home page, too, but will have a slightly different user experience, as shown in this screenshot:
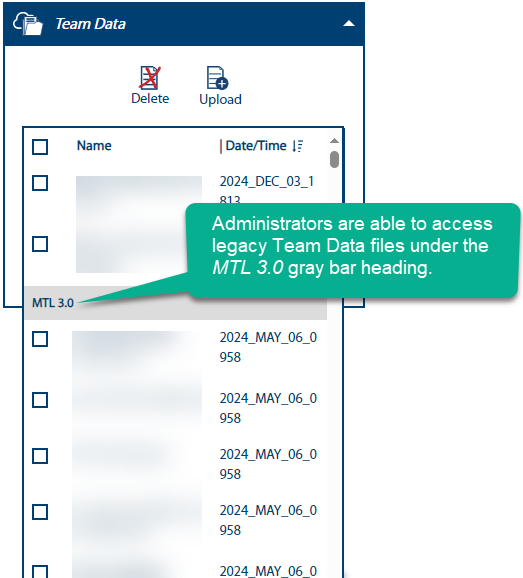
Note: Only Administrators and the internal team have access to the following functions.
- Administrators can upload team data files and assign that file(s) to team(s) of their choice.
Please note these specifics about the behavior of team data files:
- When a team data file is uploaded into a _shared or _team world, it will be available in all worlds (_ind, _team, and _shared) for all users of those worlds.
- When a team data file is uploaded to an _ind world, it is accessible exclusively to the _ind world only.
- When a team data file is deleted in a _shared or _team world, they are deleting it from _shared and _team worlds for all users of those worlds. This will not impact _ind worlds.
- When a team data file is deleted in an _ind world, it will be removed from the _ind world exclusively.
3.3.4.1 Upload a New Team Data File to a Team
- From the Administrator Dashboard, click Settings.

- Within the Data side of this pop-up, click Add.

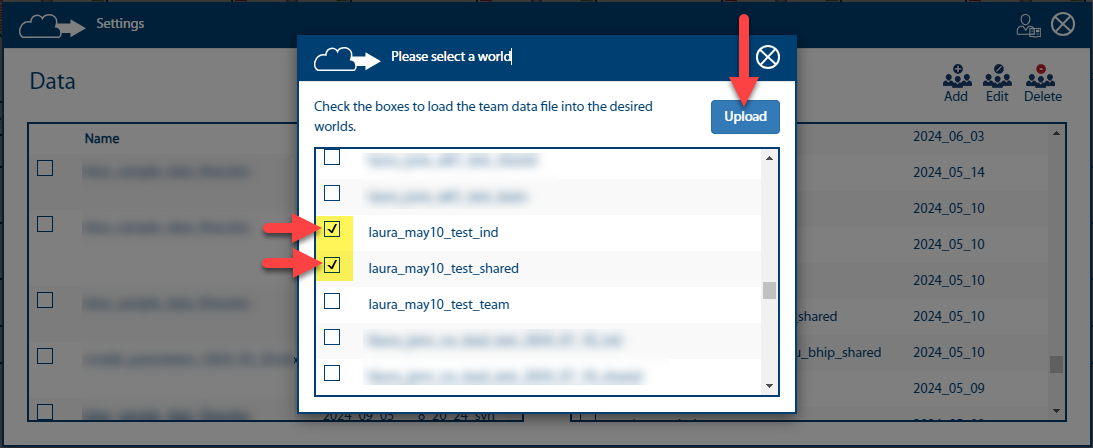
- A Please select a world pop-up will appear. Select the world(s) in which you want the team data to appear and click Upload.
- A pop-up window will appear asking if the data file is in Power BI format. Ensure it is and click Yes to proceed. The File Manager will appear.
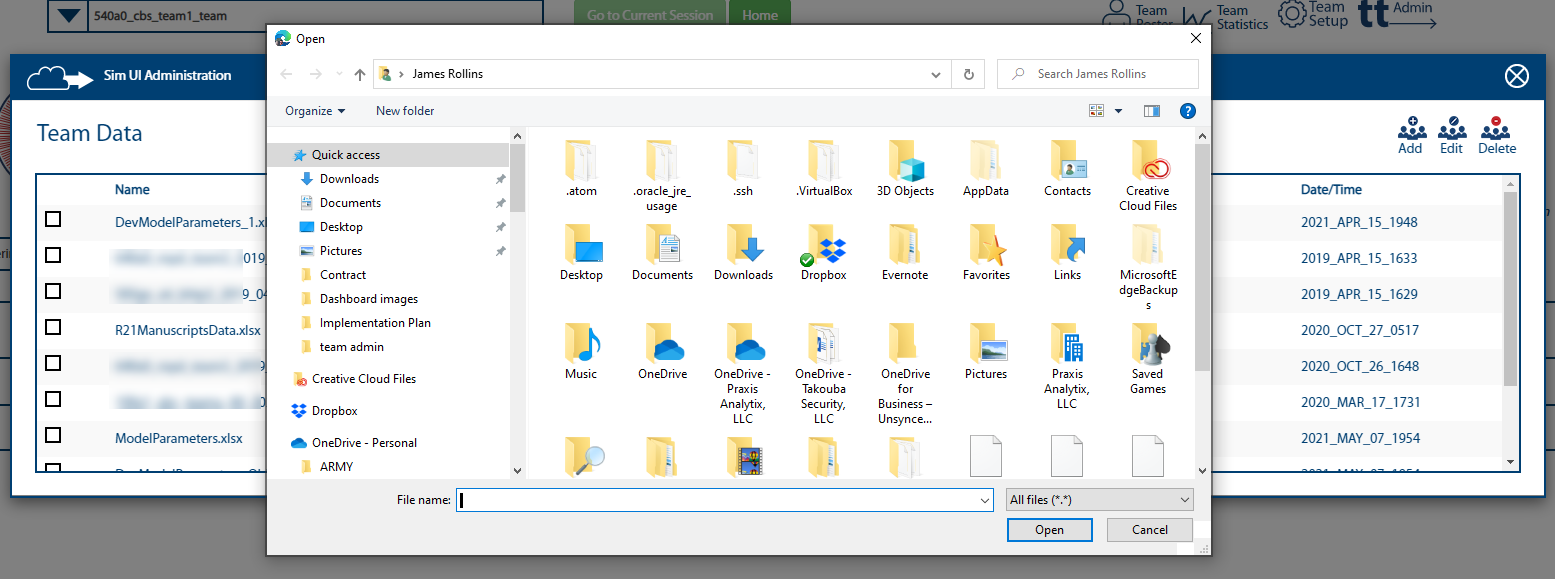
Navigate to the location of the downloaded team data file and click on the file name.
Click Open to upload the file. Be patient; it may take a while for the file to upload.
Notes:
- The upload routine must update multiple GitHub repositories and Epicenter, which may take a few minutes. If the file does not appear in the Data side of the Settings pop-up, try clicking the Refresh button.
- Do not attempt to upload team data file directly to Epicenter, since the GitHub repository will overwrite the files on the next update and they will not work when you try to access them from the Sim UI.
- Excel (.xlsx) data files exported from the MTL Data UI (Power BI), or uploaded from your MTL MS Teams, are in the correct format. Downloading and re-uploading data files from the MTL Simulation UI will not work.
3.3.4.2 Delete a Team Data File
- From the Administrator Dashboard, click Settings.

- Within the Data side of this pop-up, select the team data file you want to remove, then click the Delete icon.
Notes: As a reminder,
- When a team data file is deleted in a _shared or _team world, it is deleted from _shared and _team worlds for all users of those worlds. This will not impact _ind worlds.
- When a team data file is deleted in an _ind world, it will be removed from the _ind world exclusively.
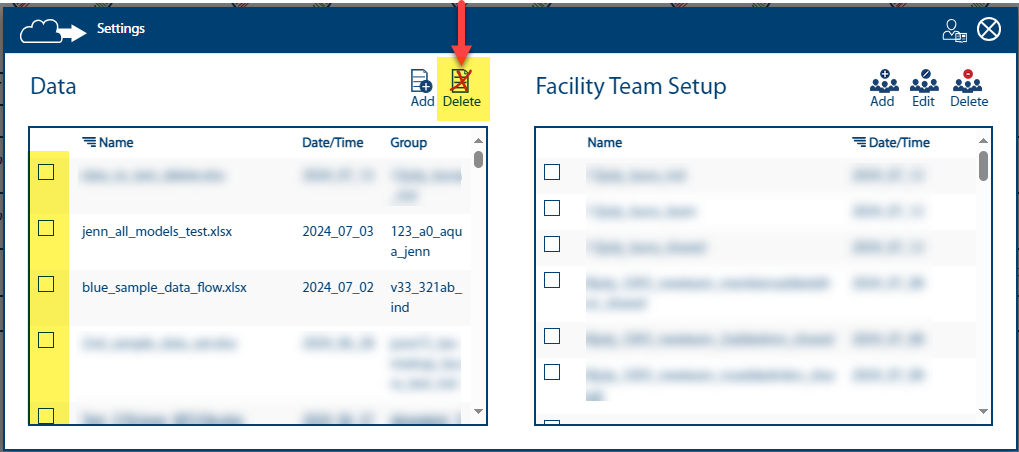
A message will appear, asking you to confirm deletion of the selected file. Select No if you want to cancel this action.
Upon successful deletion, a green message will display in the upper right-hand corner of the browser window.

3.3.5 Manage Experiments
Administrators are able to manage experiments by navigating to a team’s Home page and expanding (see red arrow) the Experiment blue bar. The Sim displays the team name and Administrator when logged in as an Admin. Note that the current team (team loaded in on the Home page) shows up first on the Experiments list (see highlighting):
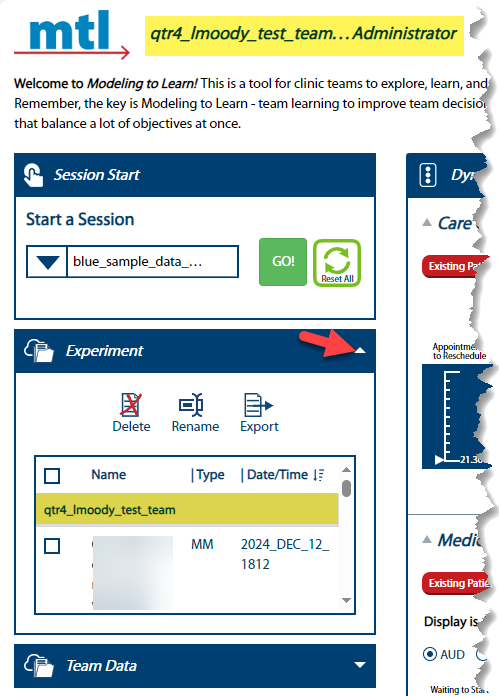
Administrators have a different user experience when viewing Experiments on a team’s Home page:
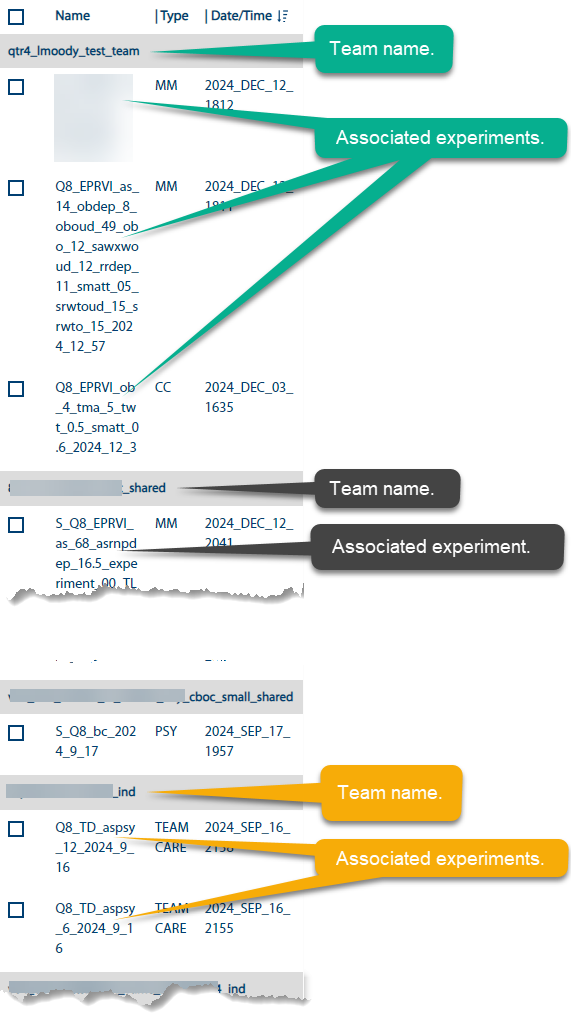
- Admins are able to see ALL experiment data across all worlds.
- Experiments are organized by their associated groups in the Experiments window so Administrators are able to associate experiments with their respective groups.
- The current team (team loaded in on the Home page) shows up first on the list.
- Gray bars denote team names & worlds.
- Checkbox selections under each are experiments associated with the team.
- FYI: The Experiments window shows experiments for all groups, but the Select Team dropdown on the Admin Dashboard only shows groups to which you belong.
Administrators manage experiments using the same functions as field users. Refer to the following sections within the field user section of this manual to learn how to manage Experiments in the Sim:
3.3.6 Modeling to Learn Maintenance Dashboards
The MTL Maintenance Dashboards provide customizable information and messaging capabilities for webpages in the Sim UI. Upon logging into the Sim UI as an Administrator, the MTL Maintenance Dashboards icons are viewable along the header bar of the Sim UI.
3.3.6.1 Orient to the Maintenance Dashboards
The following screenshot will orient you to general features of the Maintenance Dashboards, located in the top navigation bar of the Administrator Dashboard.
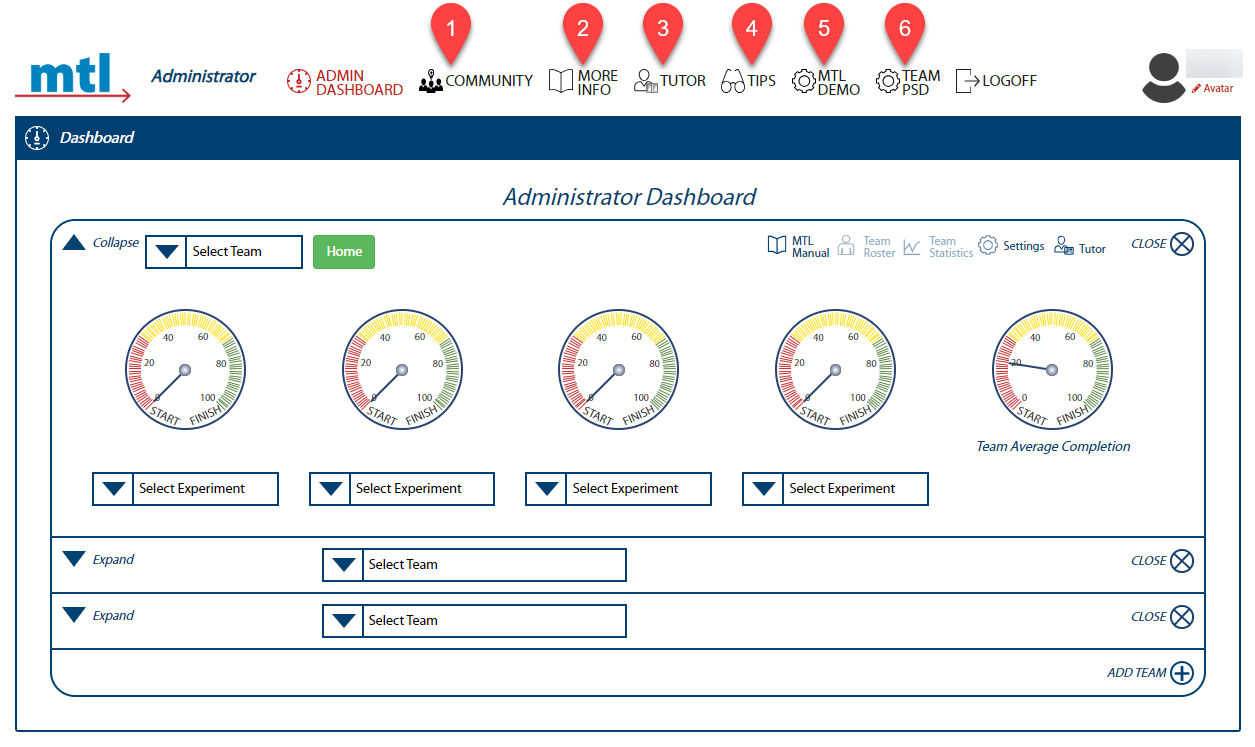
- Community Function Administration: View lists of issues reported by users from the Report Bug and Community Button, and issue outgoing email messages and targeted ANDON Alerts.
- More Information Page Administration: Manage images and reference links in the Information Page. Add and edit Module Section information. Add and edit Dynamic Decision Dashboard Directives.
- Tutor Administrative Dashboard: Manage text descriptions and web links for tutor prompts for the Home Page, each module, the Dynamic Decision Dashboard, and each module’s story.
- MTL Quick Tip Loading Screen Administration: Add icons and descriptive text for tips that appear when MTL screens are loading.
- MTL Demo Webpage: Manage the MTL Demo website, such as adding course codes, managing Demo user lists, and managing page content such video and reference links, text descriptions, and others.
- Team PSD Webpage: Manage the Team PSD website, like adding award winners, adding new team member biographies and photos, or changing page content.
3.3.6.2 Community Function Administration
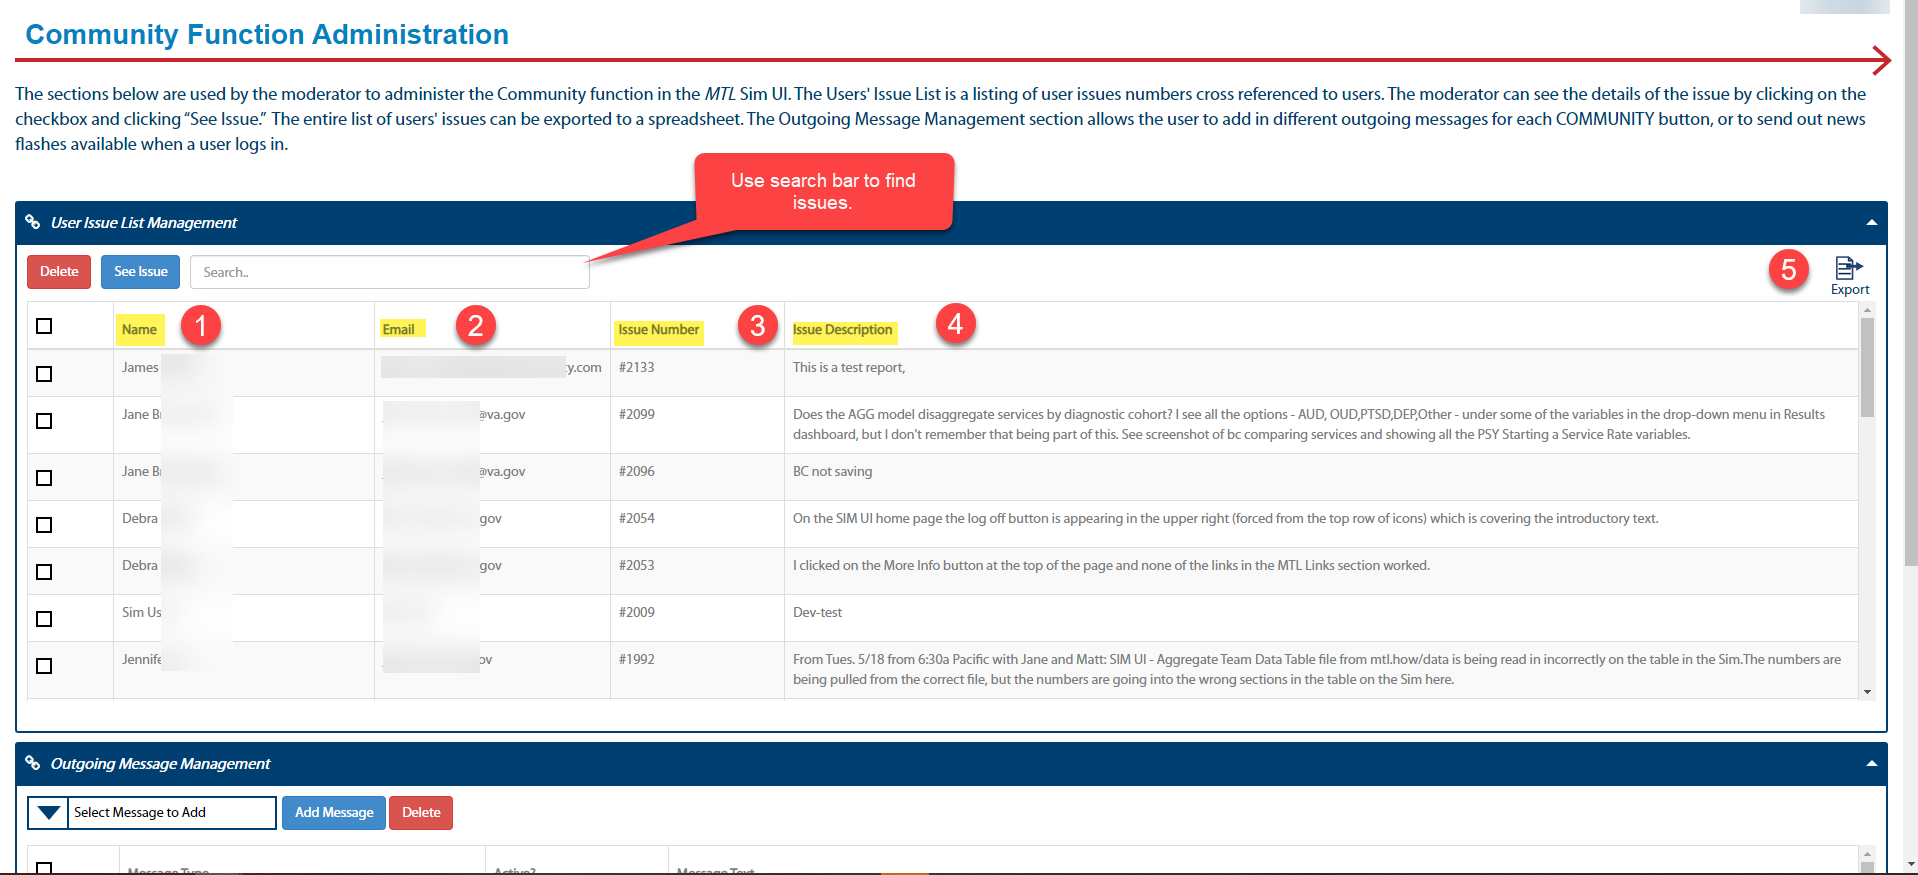
- Name of user submitting the issue.
- Email of user submitting the issue.
- GitHub issue number assigned by GitHub API.
- Description of the issue.
- Click the “Export” button to download an spreadsheet file of the list.
3.3.6.2.1 User Issue List Management
Use this section to review issue information. The listing only contains a text description of the issue. Sometimes users submit files or screenshots. To view these details:
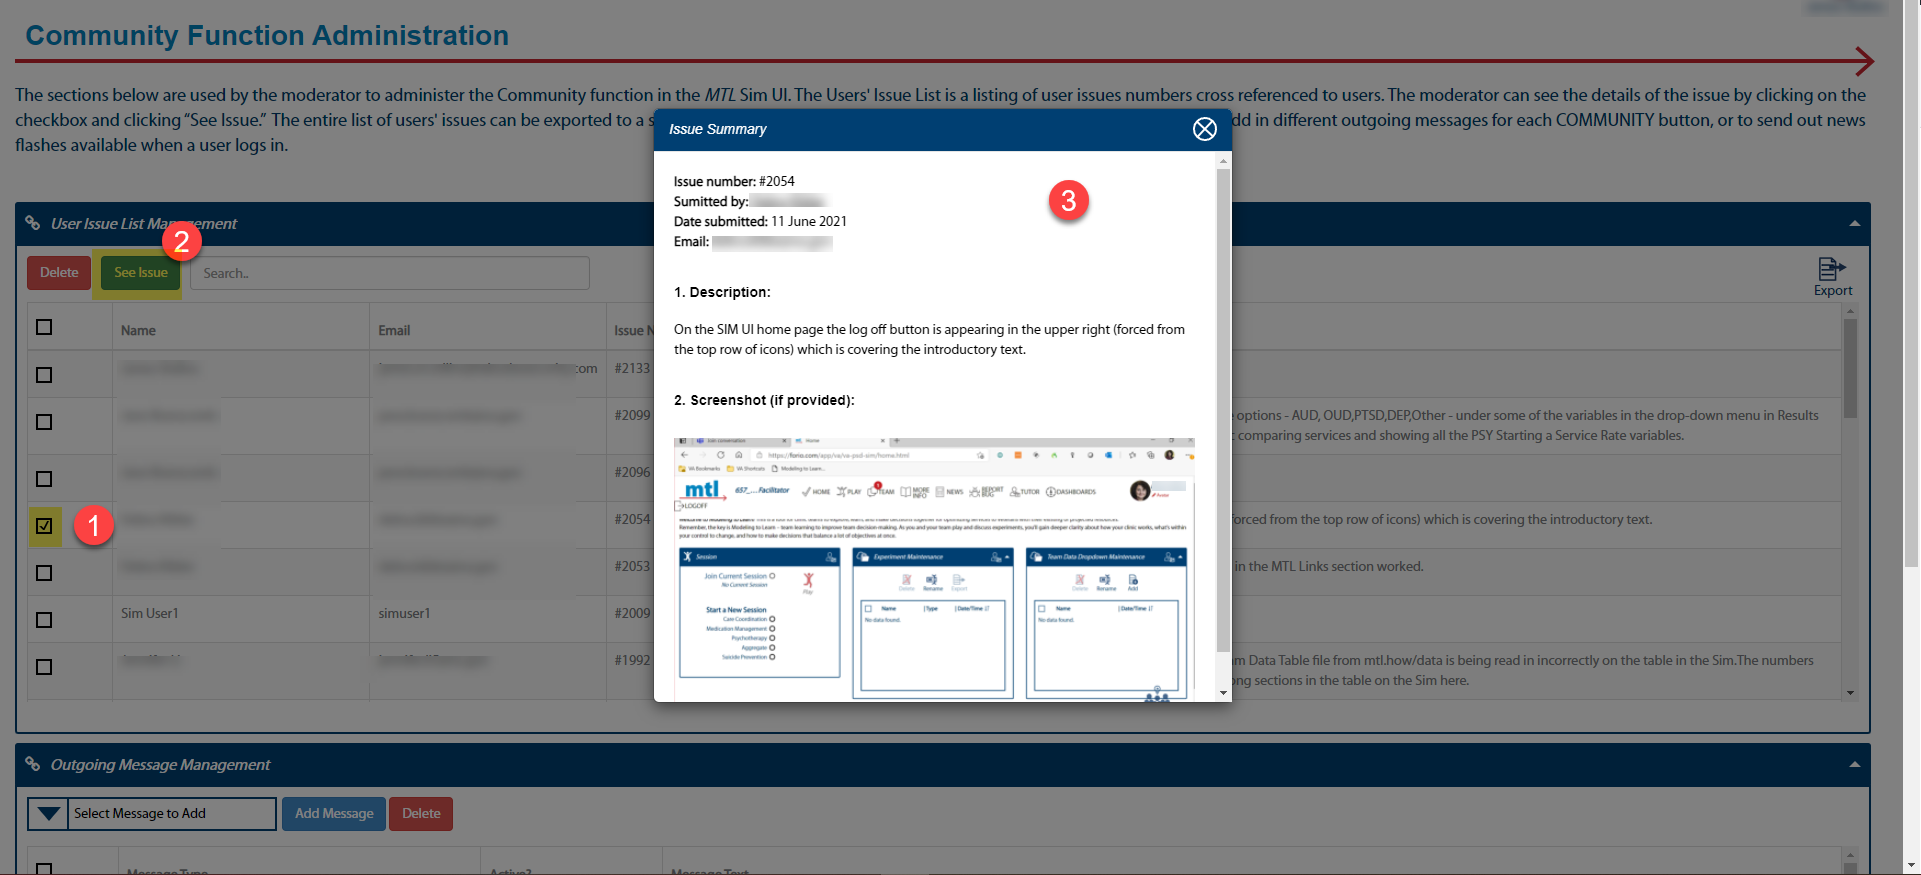
- Click the checkbox next to the issue.
- Click “See Issue” button.
- Review information in the pop-up.
3.3.6.2.2 Outgoing Message Management
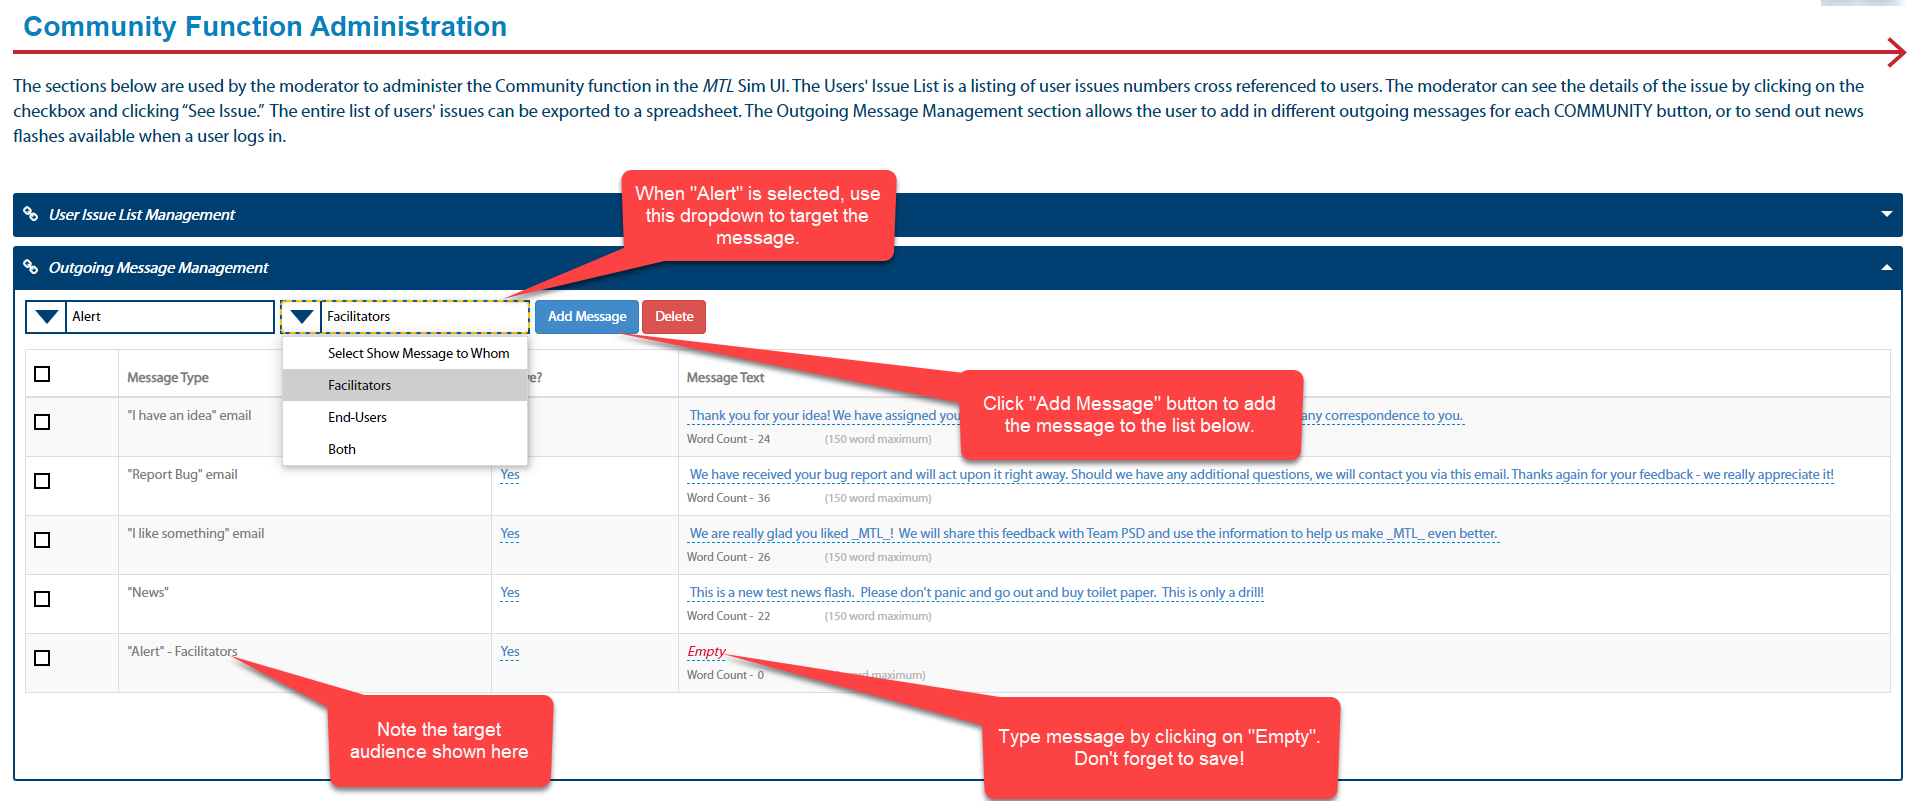
The Sim UI sends out email and other messages to mass communicate important information. There are 5 types of messages.
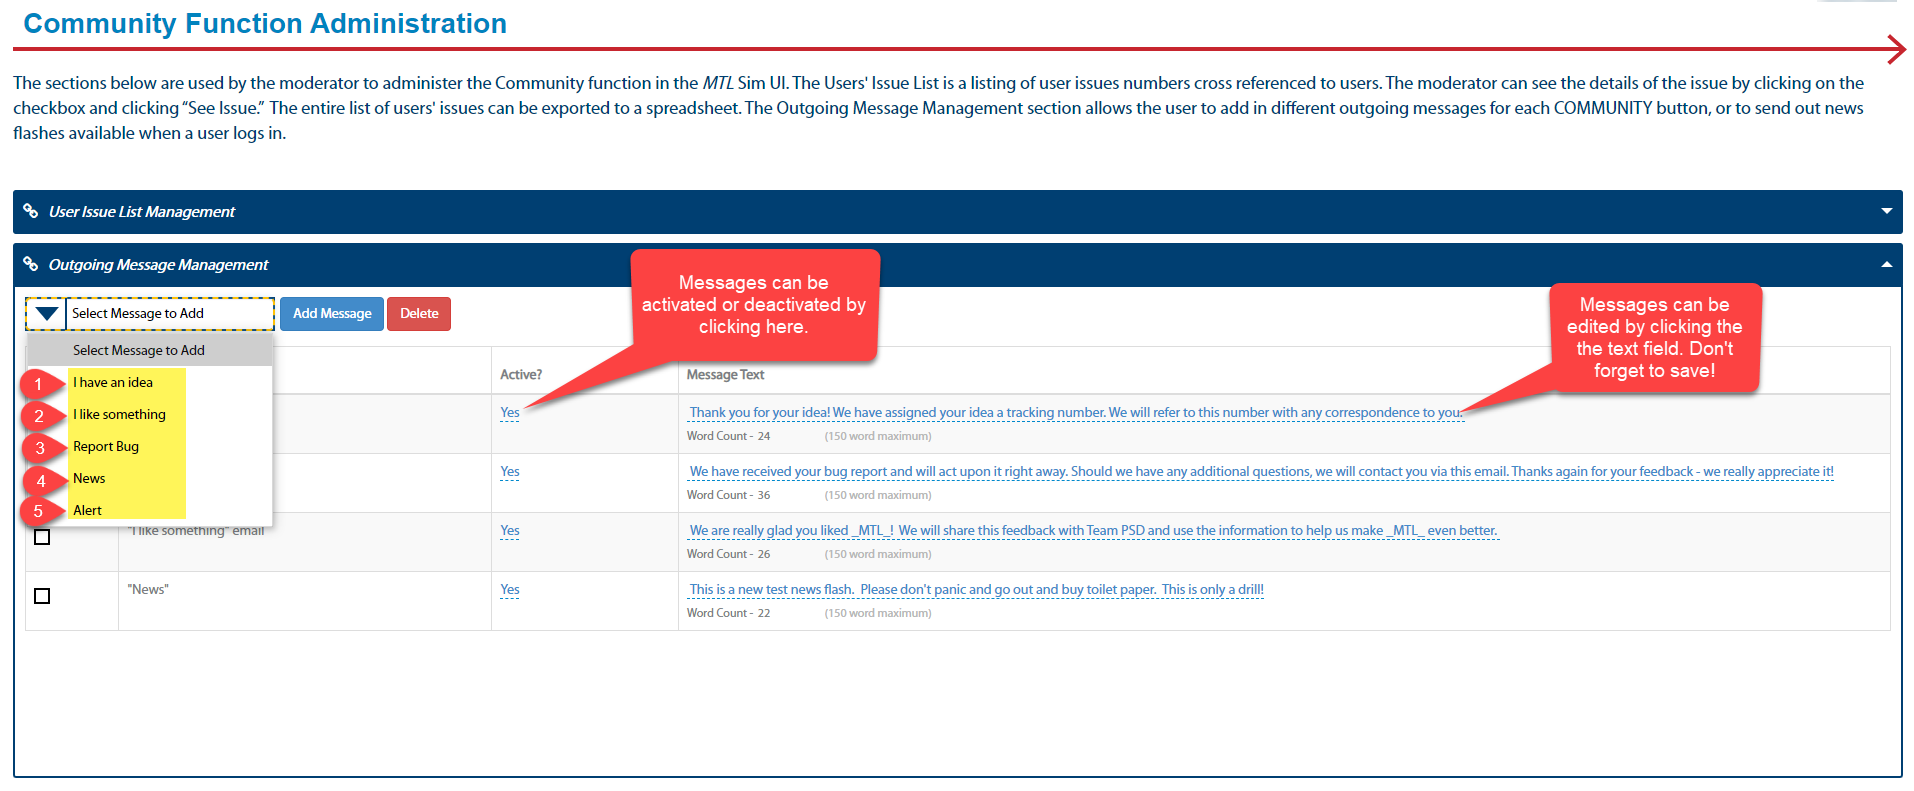
- I have an idea: This is an outgoing email that informs the user that we have received their idea.
- I like something: This is an outgoing email that informs the user that we have received and appreciate their message.
- Report Bug: This is an outgoing email that informs the user that we have received their bug report and will act on it. It also returns an issue number for their reference.
- News: Every user has a News button on their Home webpage. When clicked, it will display news items on their webpage that were set up with this function.
- Alert: Also known as an ANDON alert, this is an outgoing message that displays on the Home webpage when the user logs in. It can target administrators only, users only, or both. ANDONS are normally reserved for problems where the user should stop using the Sim UI until the issue is resolved.
3.3.6.3 More Information Page Administration
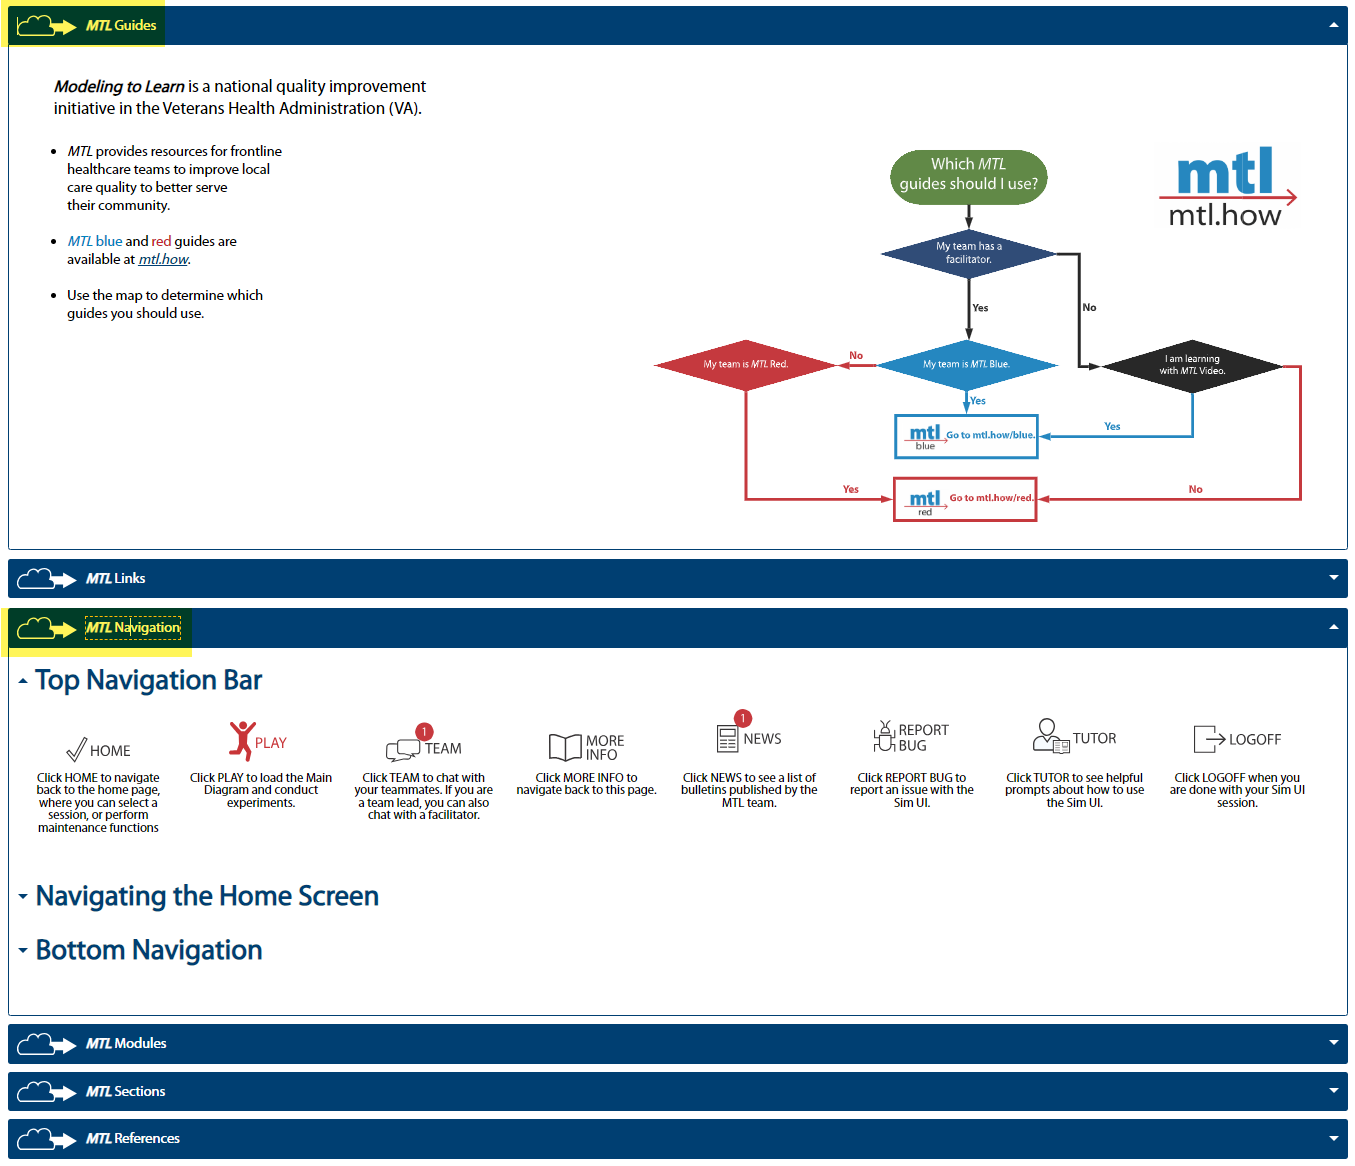
When a user clicks the More Info icon in the their header bar within the Sim UI, they navigate to a page that contains information about the Sim UI. There are multiple sections: MTL Guides, MTL Links, MTL Navigation, MTL Modules, MTL Sections, and MTL References. While the sections of this page are permanent, you can change elements inside the sections using the Administration page, accessed by clicking More Info from the Administrator Dashboard.
3.3.6.3.2 MTL Links and References Pages
Below is the MTL Links page.
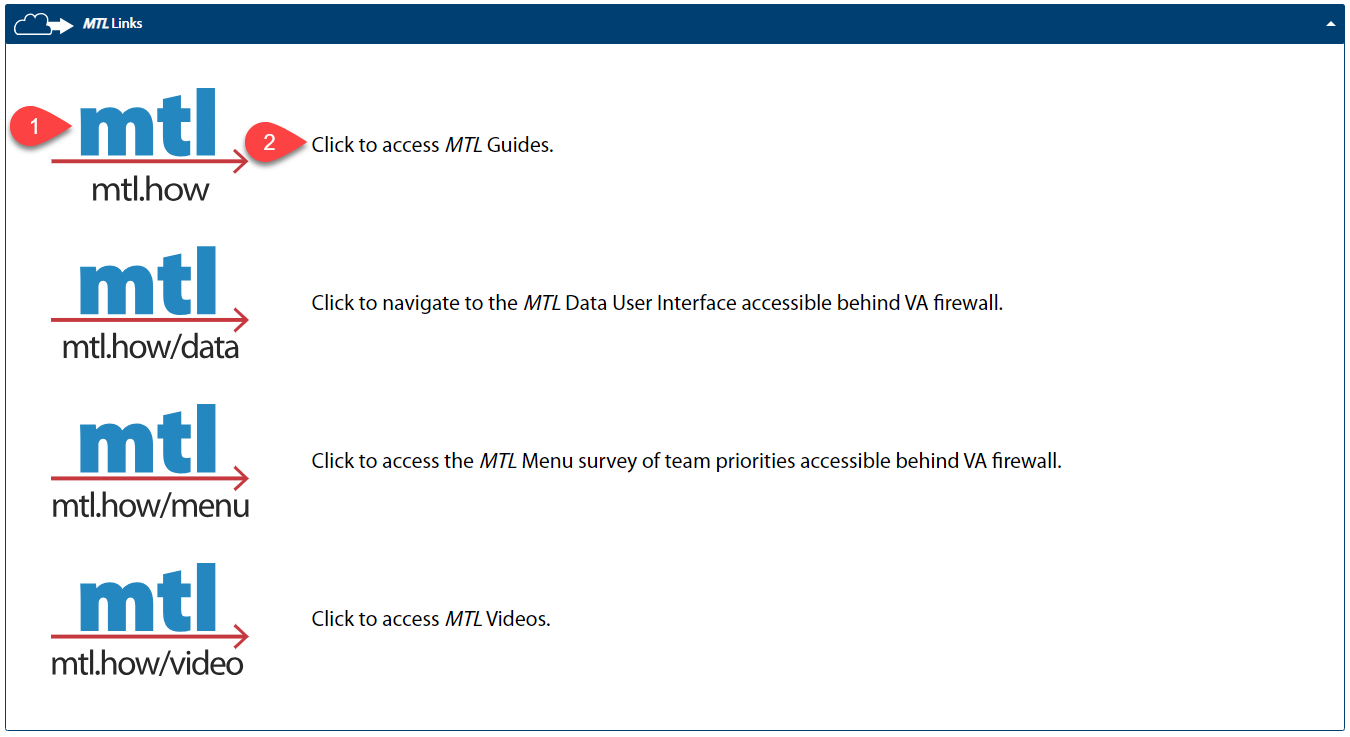
- When the user clicks on this graphic, they navigate to the mtl.how website.
- This is the text instruction.
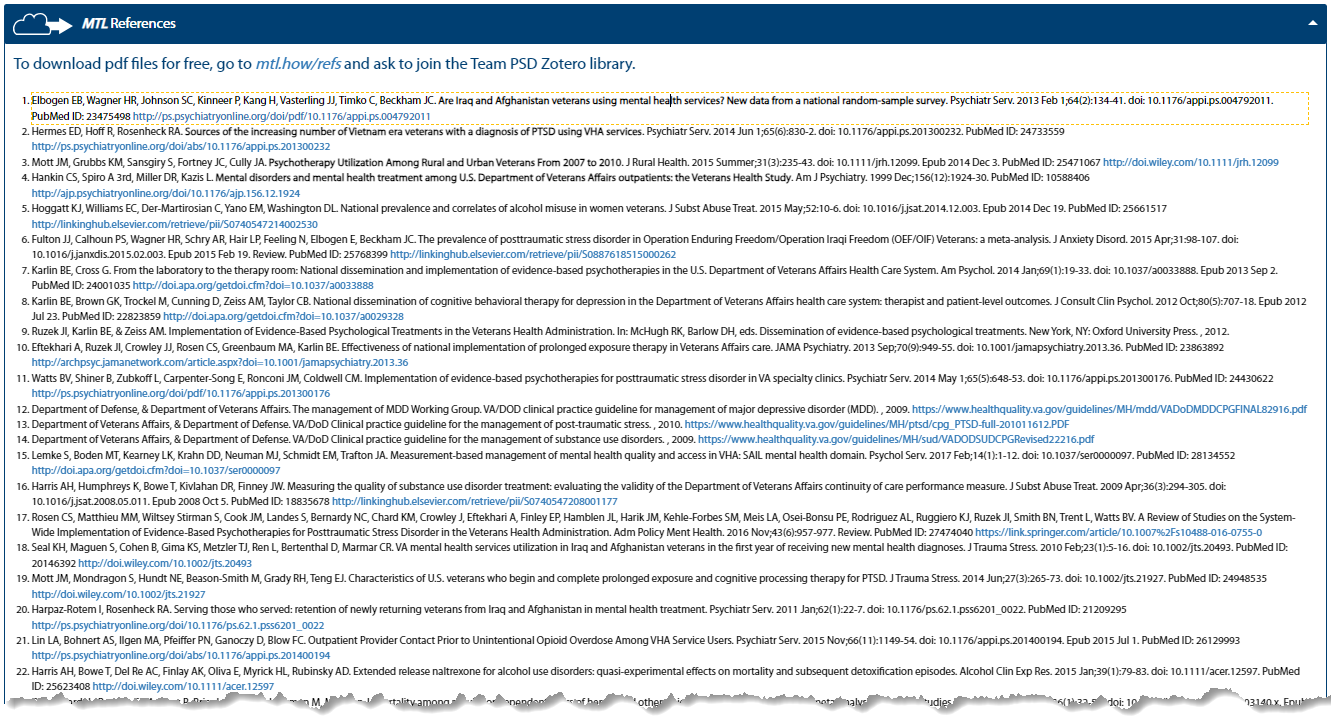
Below is the MTL References page, a bibliography that supports the research being conducted by MTL.
3.3.6.3.2.1 Update Links and References
Below is the Links and References maintenance saection of the More Info Admin page.
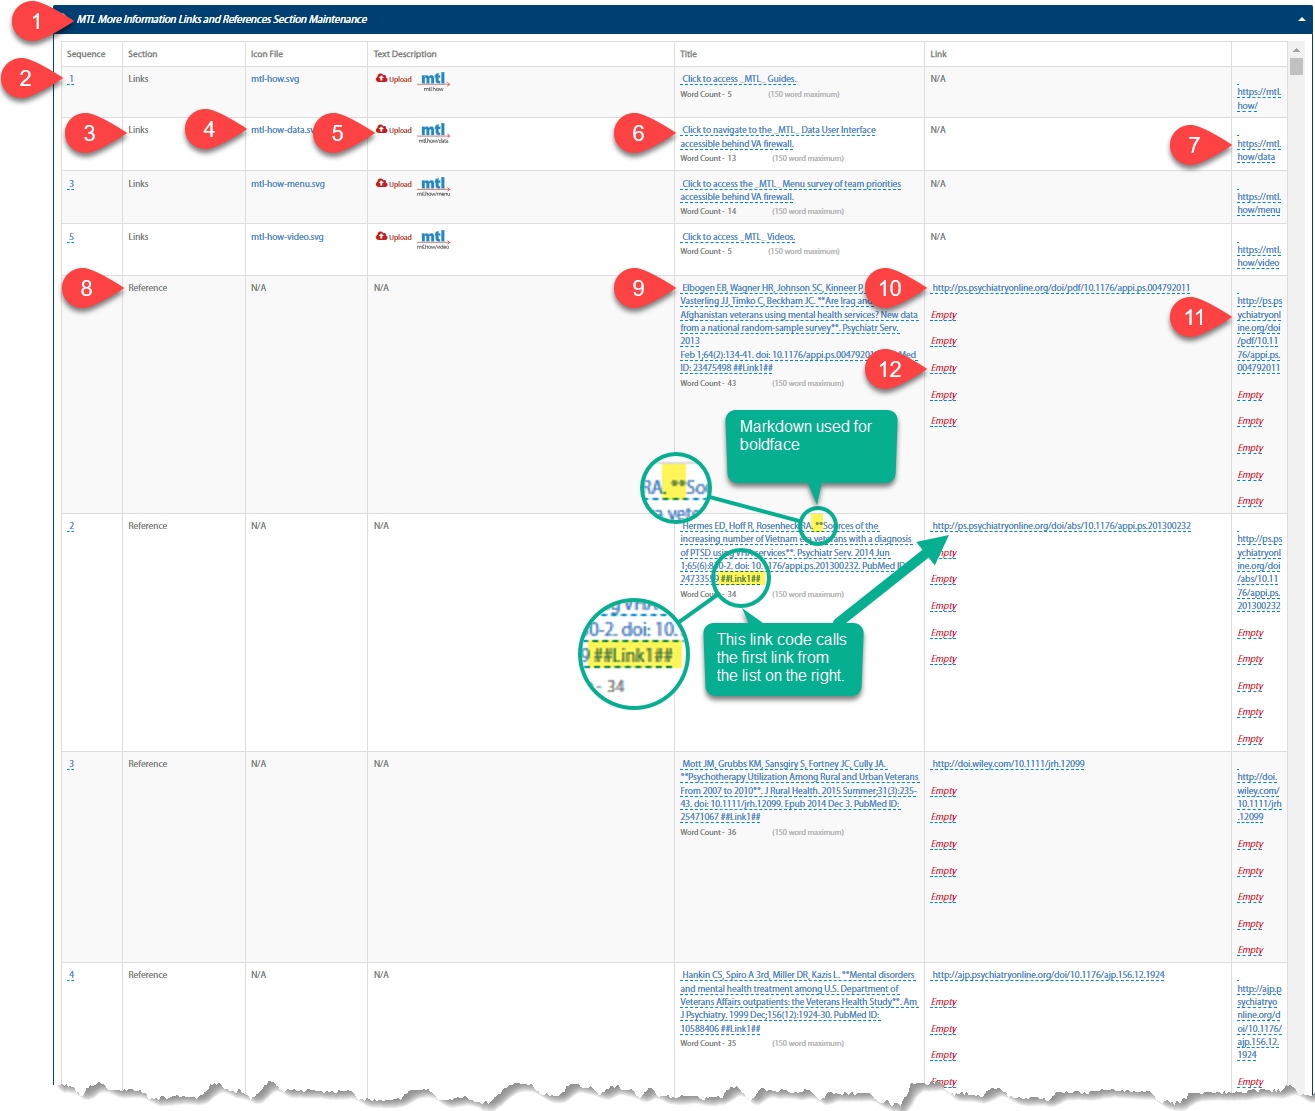
This is the title bar.
This is the sequence that the link will appear on the page. These can be modified by changing the number.
Note: All numbers will need to be updated to reflect the new sequence.
This identifies the section you’re working in: Links.
This is the file name of the graphic file.
Upload the graphic file here. A thumbnail will show when it is uploaded.
Note: Please use a .png format graphic.
The explanatory text for the graphic is shown here.
Slightly offscreen is where the url for the graphic goes.
This identifies the section you’re working in: References.
This is the explanatory text for the bibliography entry. Note that it has several characteristics. You can boldface or italicize using markdown language.
The text can have hyperlinks embedded using the ##Link1## code. The number immediately after “Link” indicates the position of the title of the hyperlink from the list.
The hyperlink title then calls the url listed in order in this column slightly offscreen.
Each entry can have up to six hyperlinks. To add a hyperlink, click on the “Empty” and a dialogue box will appear. Don’t forget to save!
3.3.6.3.3 MTL Modules Page
The screenshot below shows a table with a listing of the modules offered in MTL. In case more modules are addedt, it is possible to expand this list.
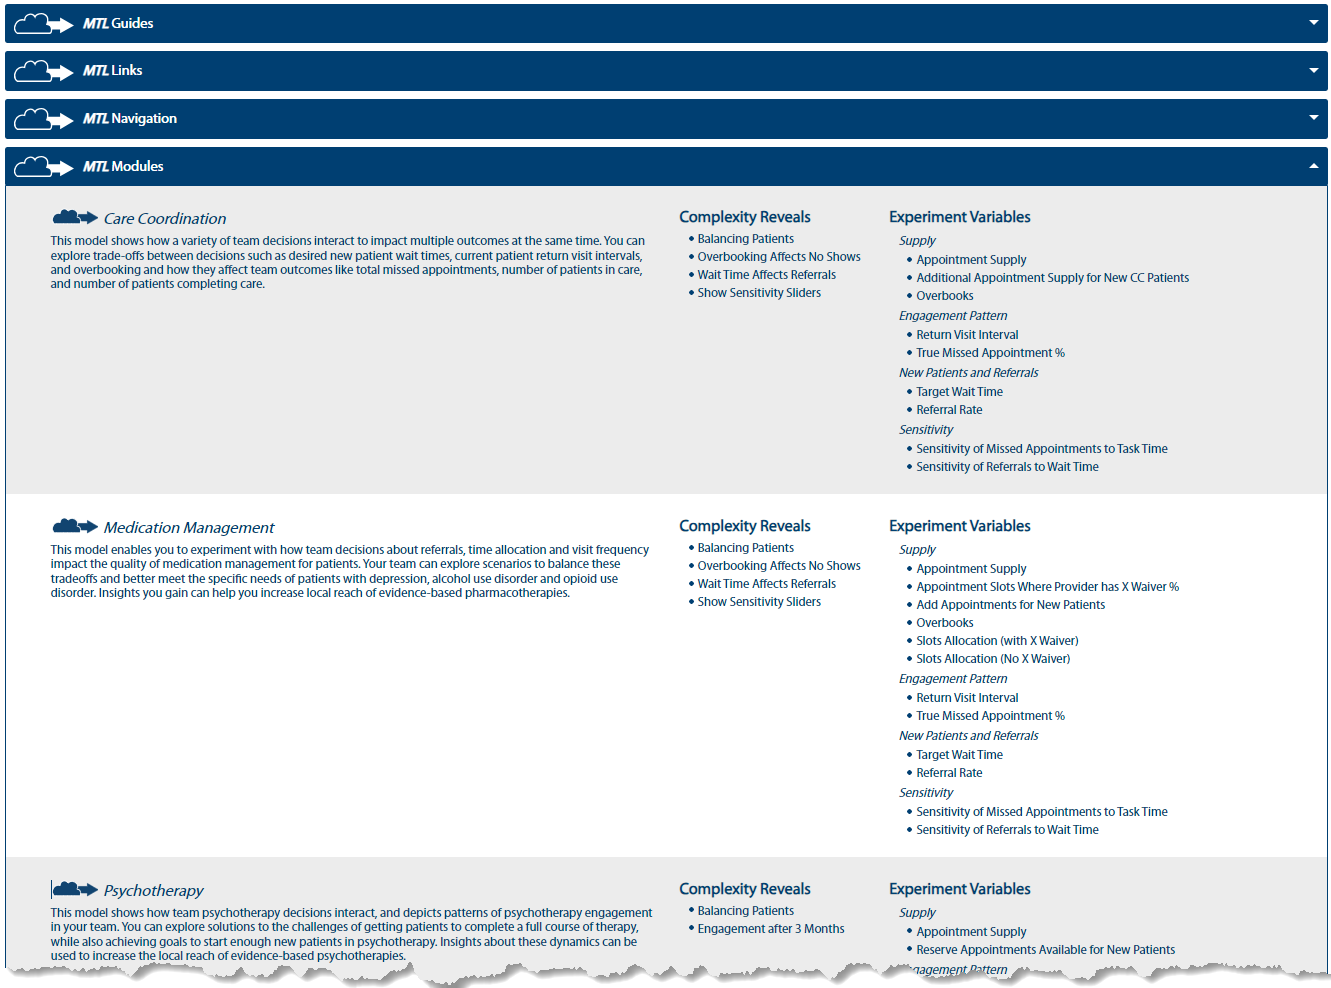
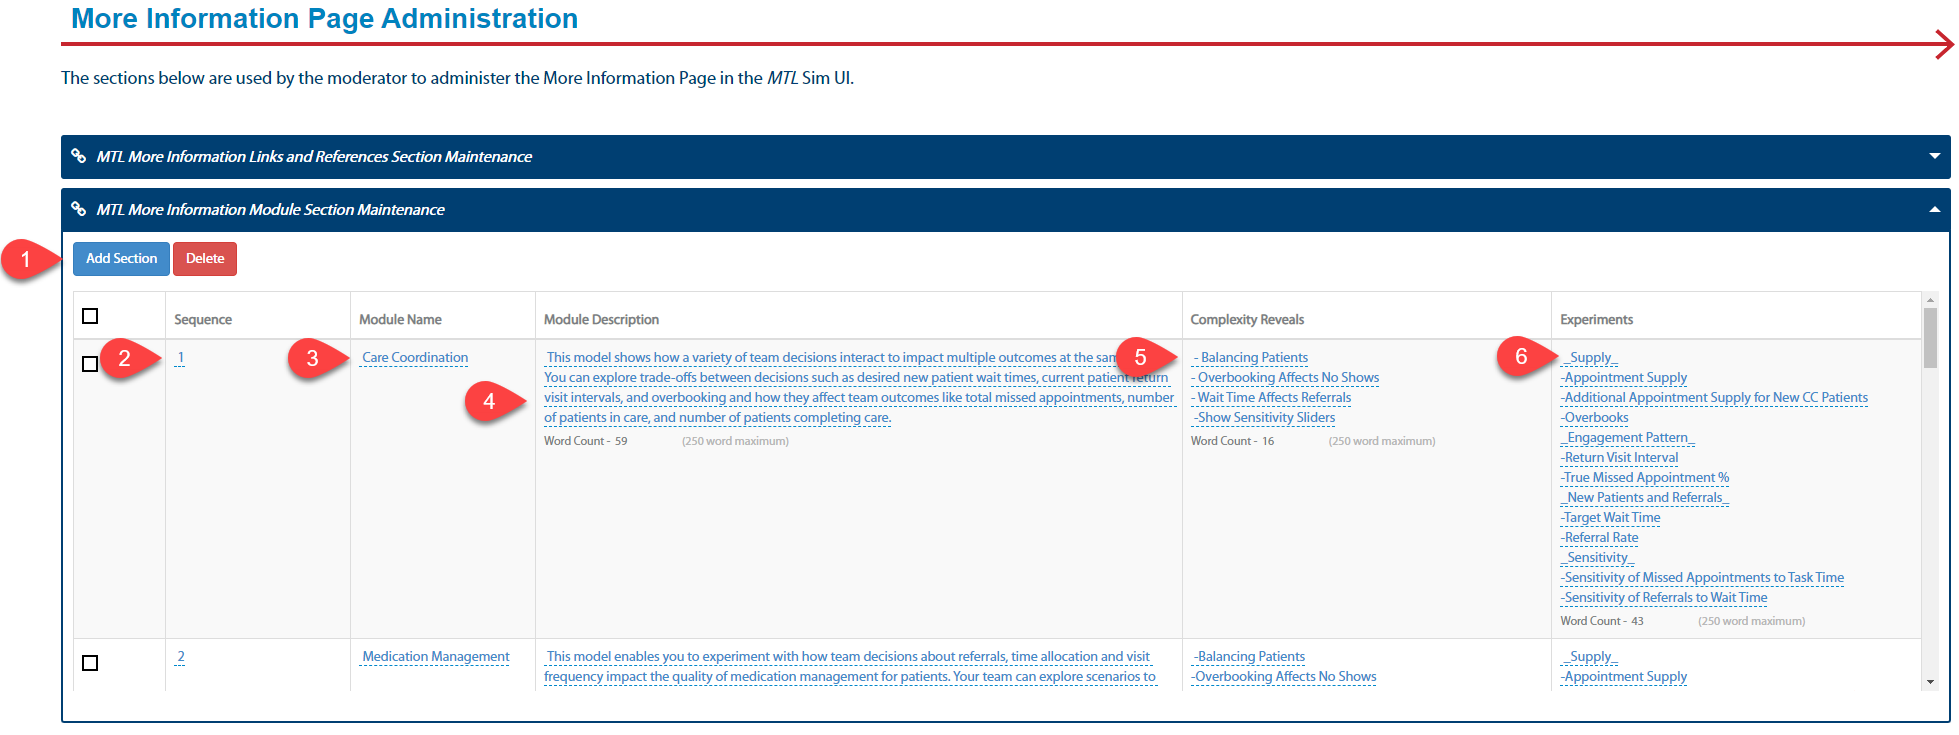
3.3.6.3.3.1 Update or Add Module Information
- Click this button to add a section. It will appear as the last row on the list.
- This is the sequence that the link will appear on the page. These can be modified by changing the number. Note: All numbers will need to be updated to reflect the new sequence.
- This is the name of the Module which appears as a title over the descriptive text in the next column.
- This is descriptive text. Click to modify. Use markdown to emphasize boldface, italics and add bullets.
- These describe the layers or complexity reveals in the module. Click to modify. Use markdown to emphasize boldface, italics and add bullets.
- These are the experimental controls available in the module. Click to modify. Use markdown to emphasize boldface, italics and add bullets.
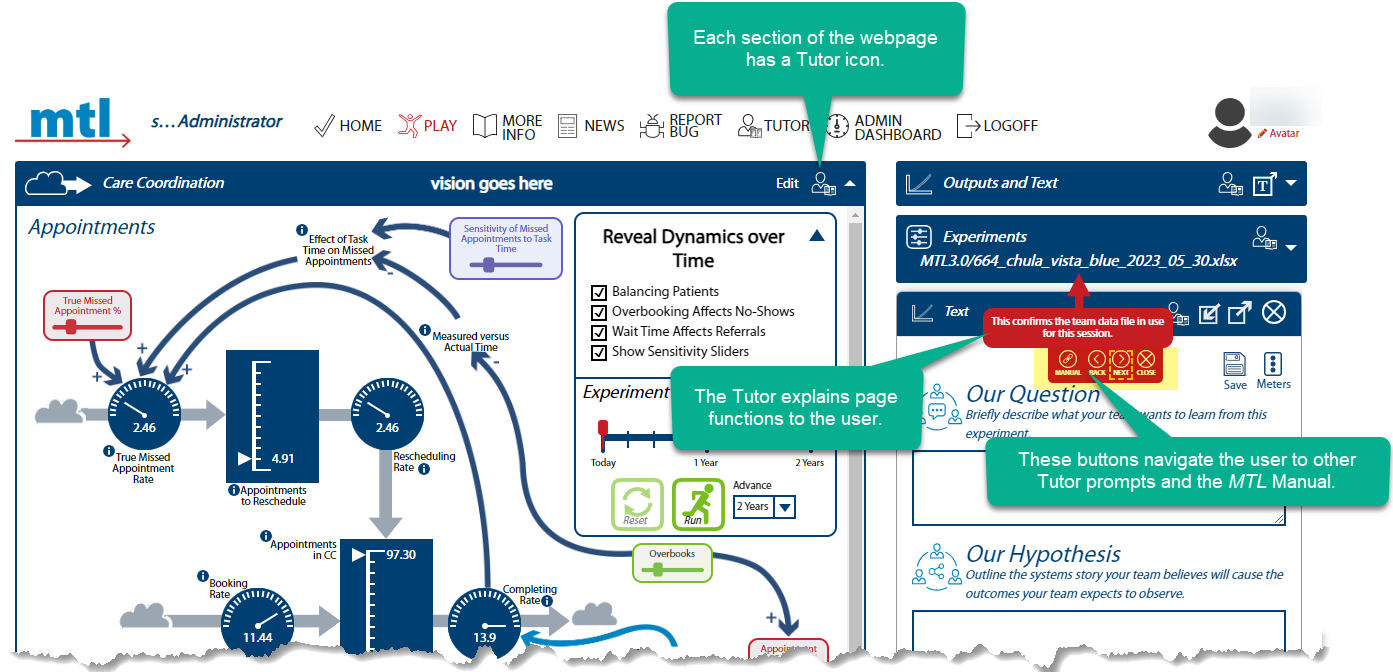
3.3.6.4 Tutor Function
The Tutor is a function in the Sim UI that explains functions on the webpage to the user. Each section on the Home, Care Coordination, Medication Management, Psychotherapy, Team Care, and Team Flow pages have a Tutor icon.
3.3.6.4.1 Tutor Administrative Dashboard
The Tutor Administrative Dashboard enables you to adjust descriptive text and links associated with each Tutor callout box. However, the user cannot add or remove Tutor callouts. These have to be added using computer code. See below for a description of these features.
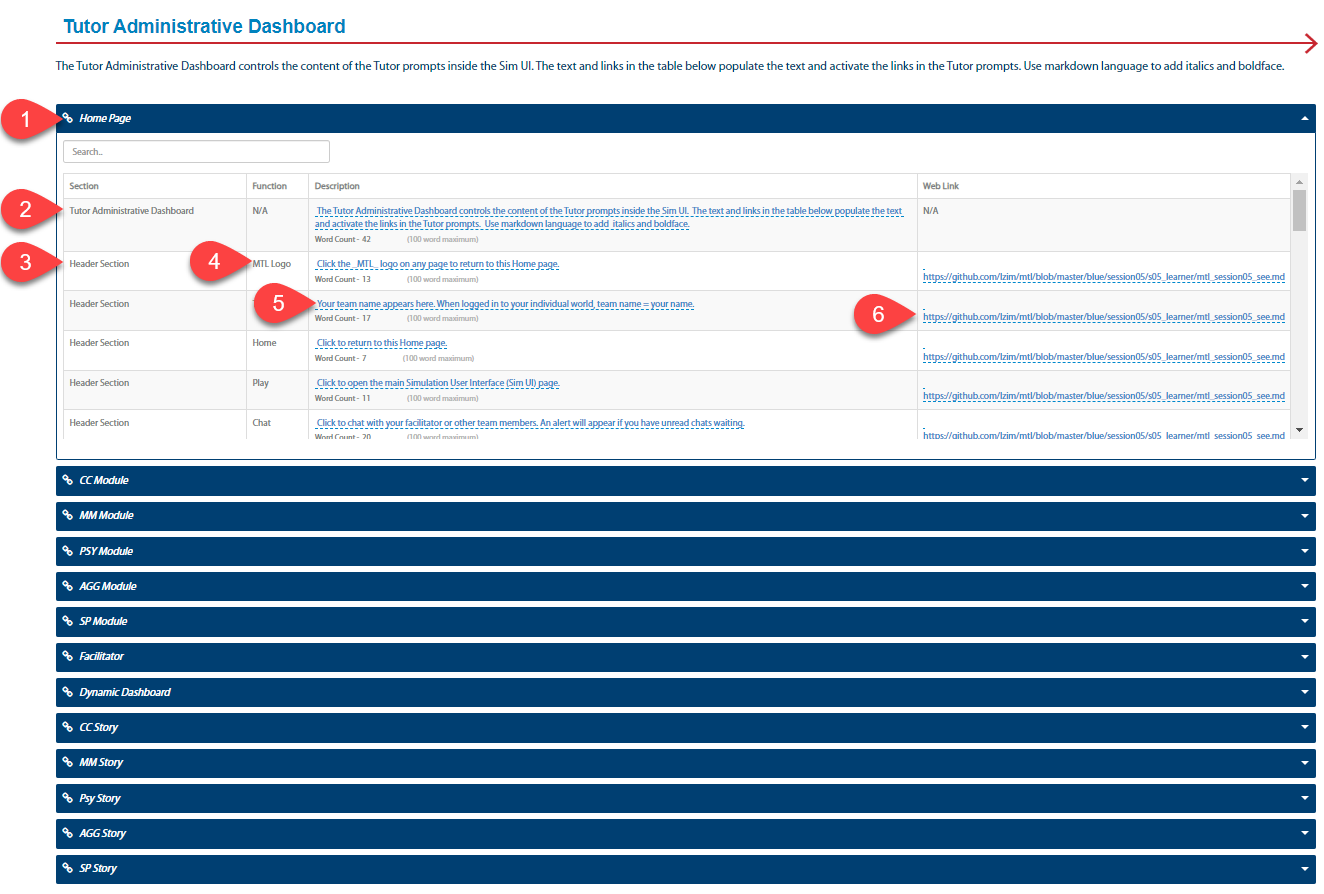
- Each page in the Sim UI has Tutor callouts. This points to the call outs on the Home page. Below are Tutor callout listings for Care Coordination, Medication Management, Psychotherapy, Team Care, and Team Flow modules; the Dynamic Decision Dashboard; and Care Coordination, Medication Management, Psychotherapy, Team Care, and Team Flow stories.
- This is a unique row that enables you to adjust the description below Tutor Administrative Dashboard title. Otherwise, it is the description of the Tutor callout.
- This is the section on the webpage where the Tutor callouts apply.
- This is the function the Tutor is describing.
- This text will show up in the Tutor callout box. To edit, simply click on the text. Don’t forget to save your changes!
- When the user clicks the link button on this Tutor callout box, the computer will navigate the user to this url. To edit, simply click on the link. Don’t forget to save your changes!
3.3.6.5 MTL Quick Tip Loading Screen Administration
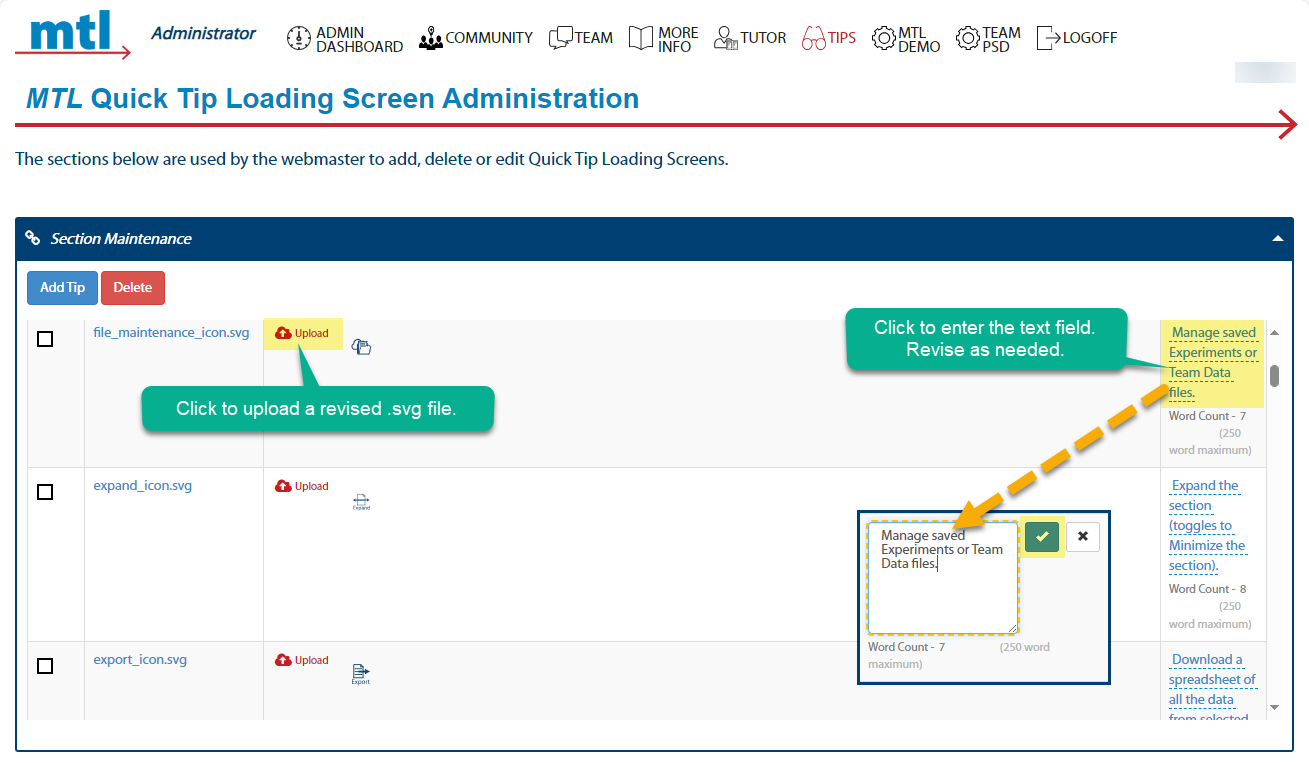
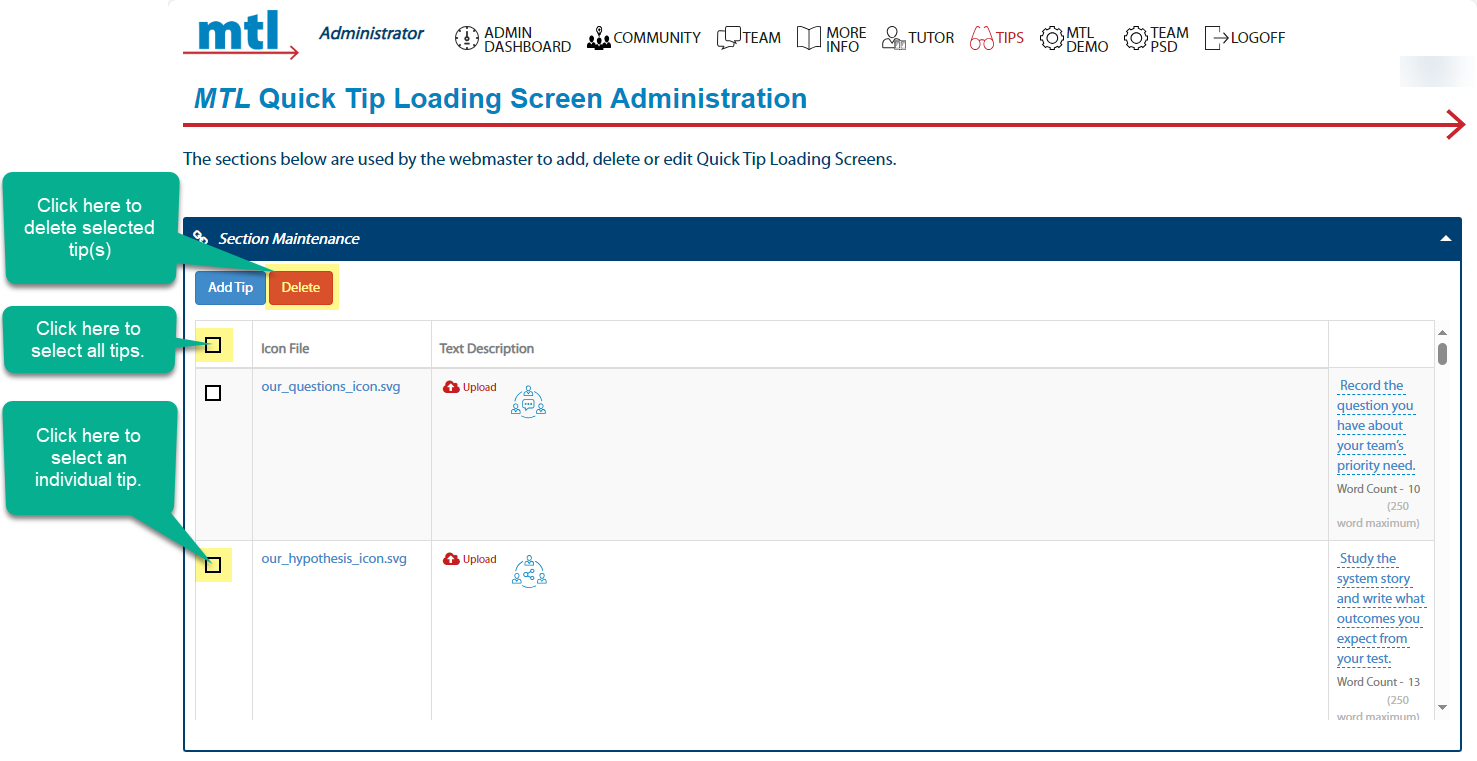
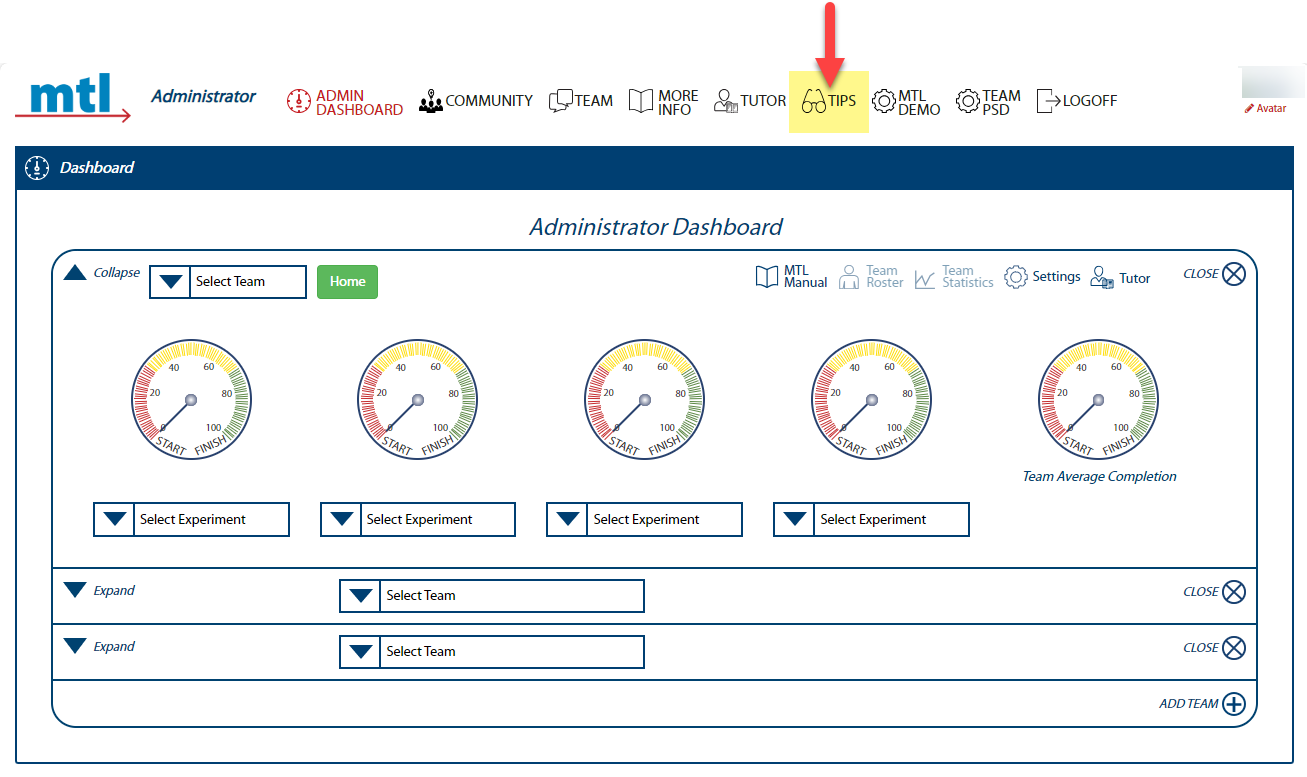
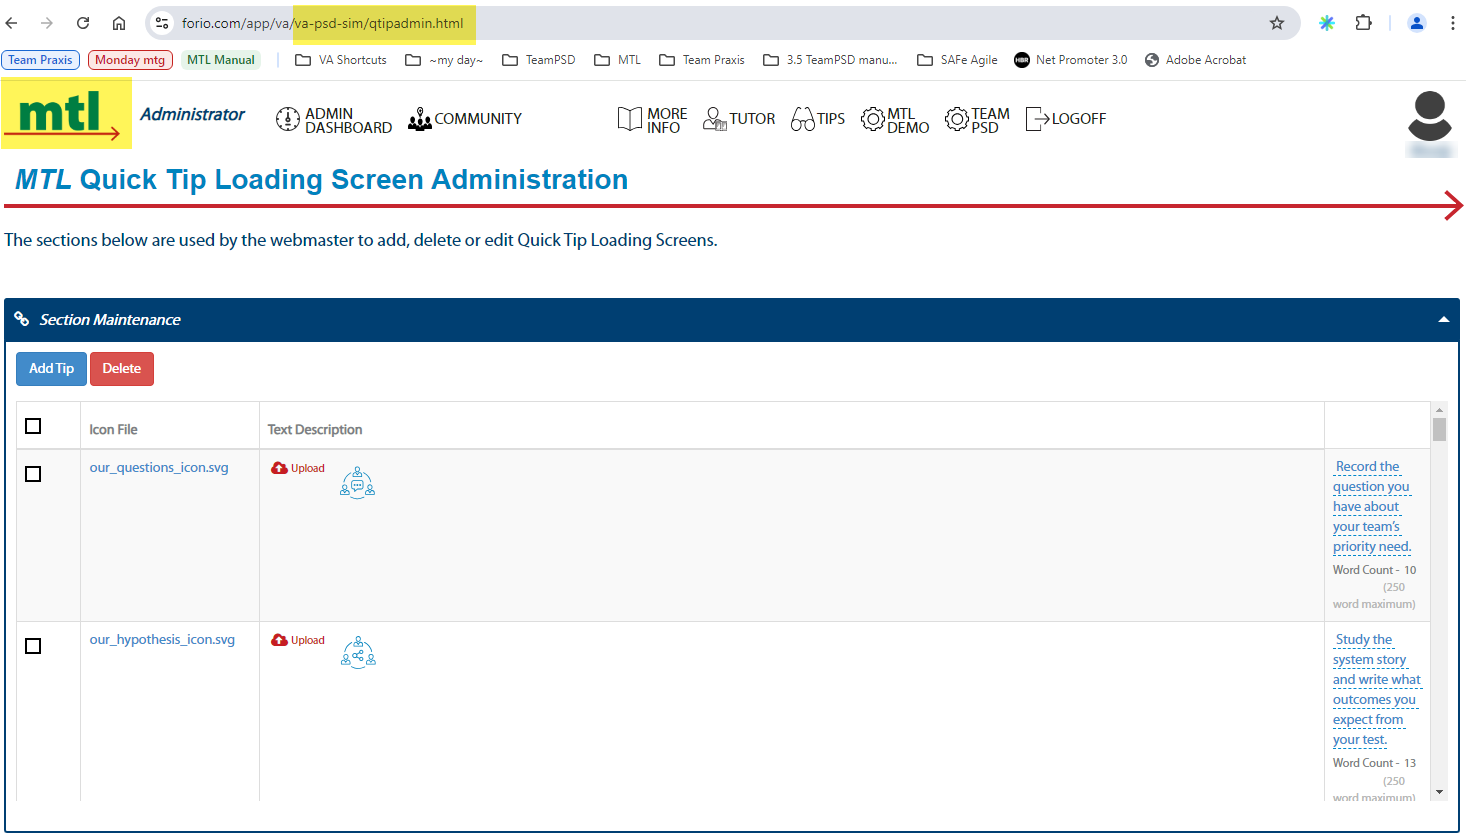
When a screen loads in the Sim UI, a blank gray screen is presented. We use this opportunity to offer suggestions or “Tips” to explain functions in the Sim UI. We have an admin webpage to create new Tips, accessible by logging in as an Administrator, then selecting Tips on the Administrator Dashboard top navigation bar:
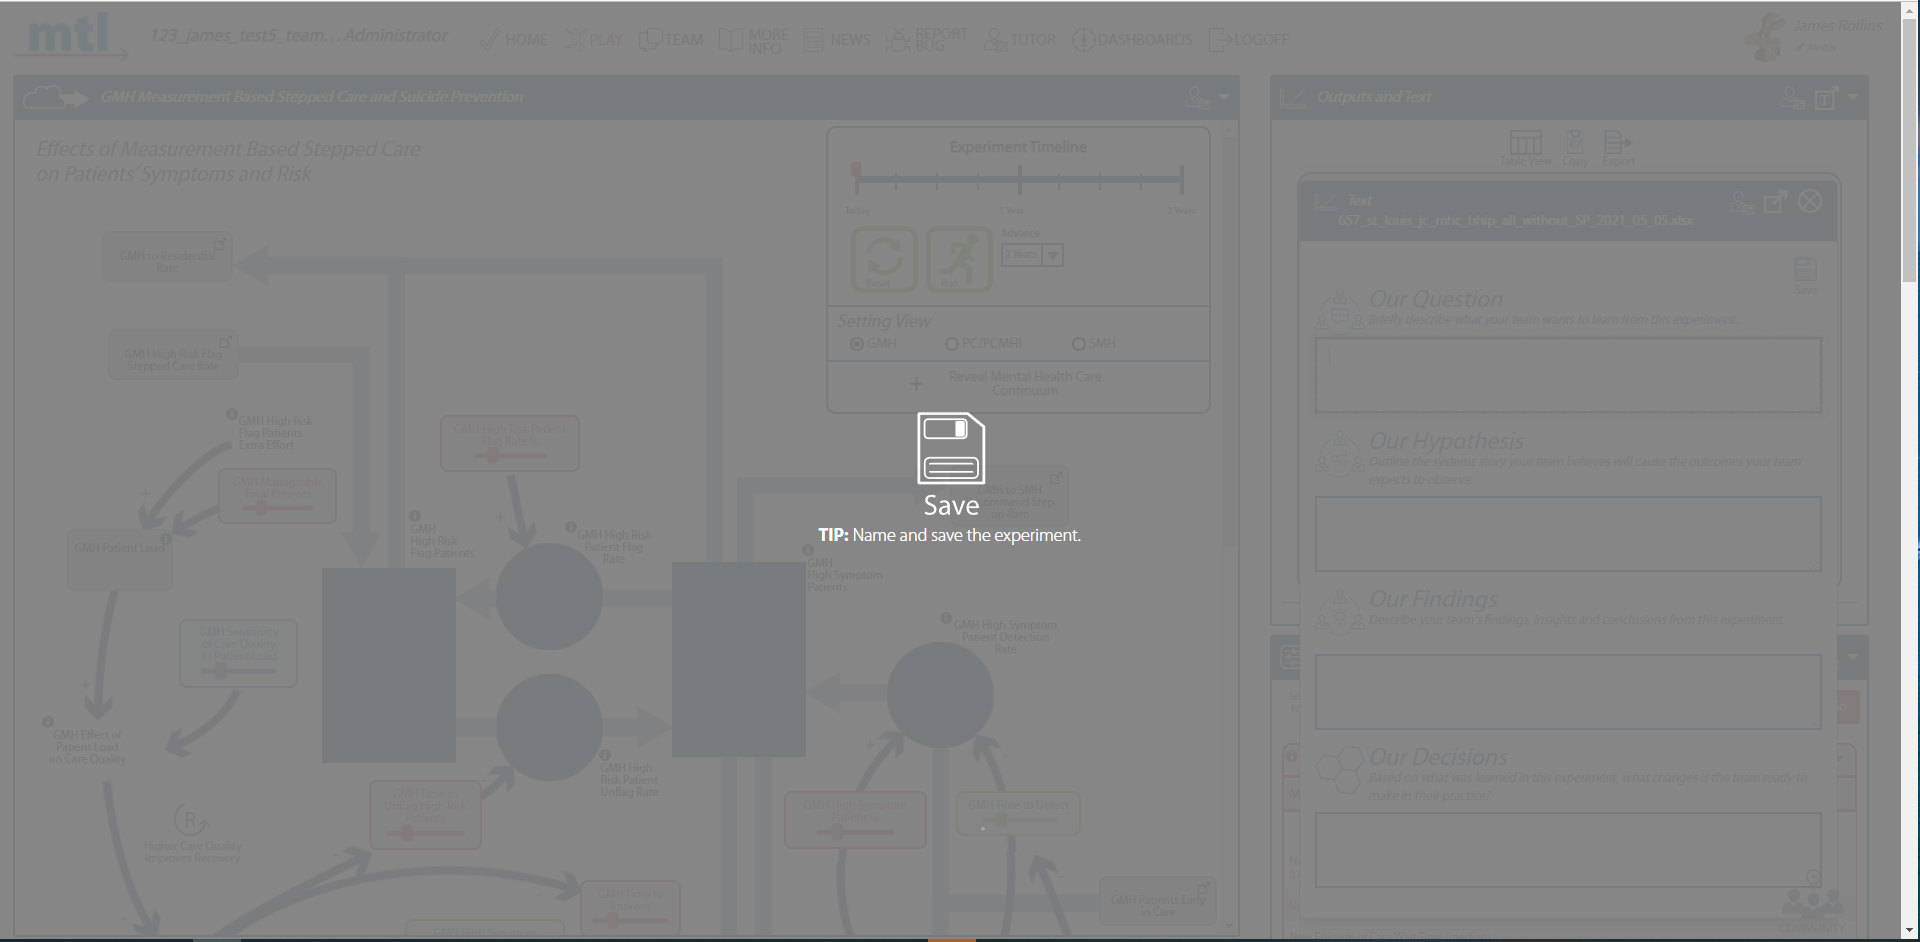
Tips usually have graphics, which are white line drawings on transparent background saved in the .svg format. When paired with text, these present on the loading screen (see example below). A repository of quick tips icons are available in lzim/mtl/images/quick_tips_files.
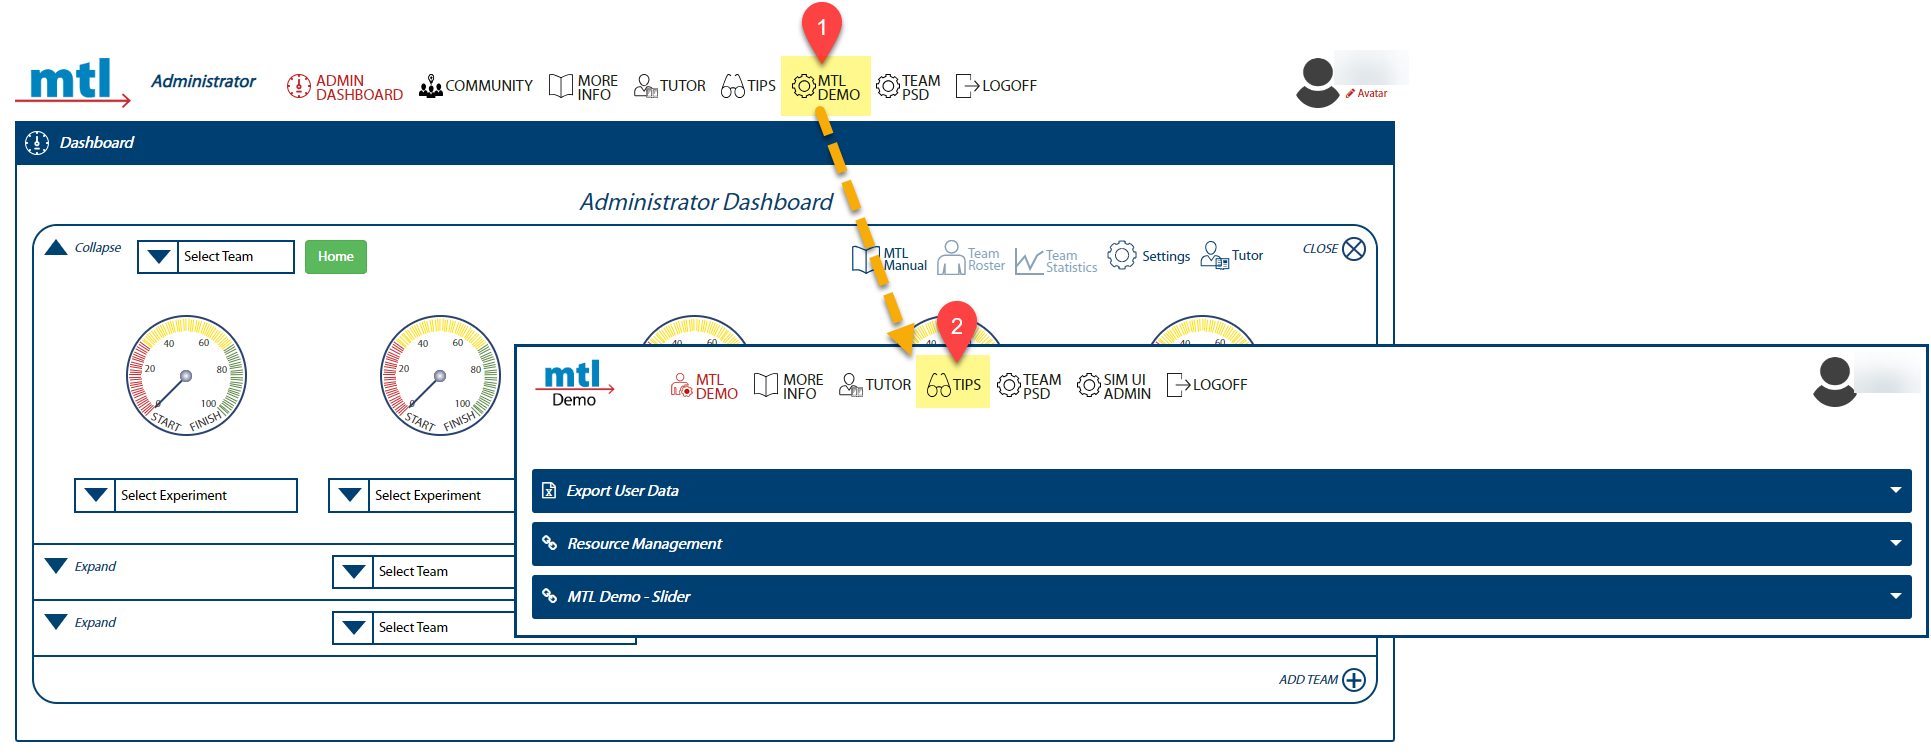
Please note that MTL Demo has its own tips management administration page.
To access this, you must:
- Navigate to the MTL Demo admin page.
- Click the “Tips” icon.**
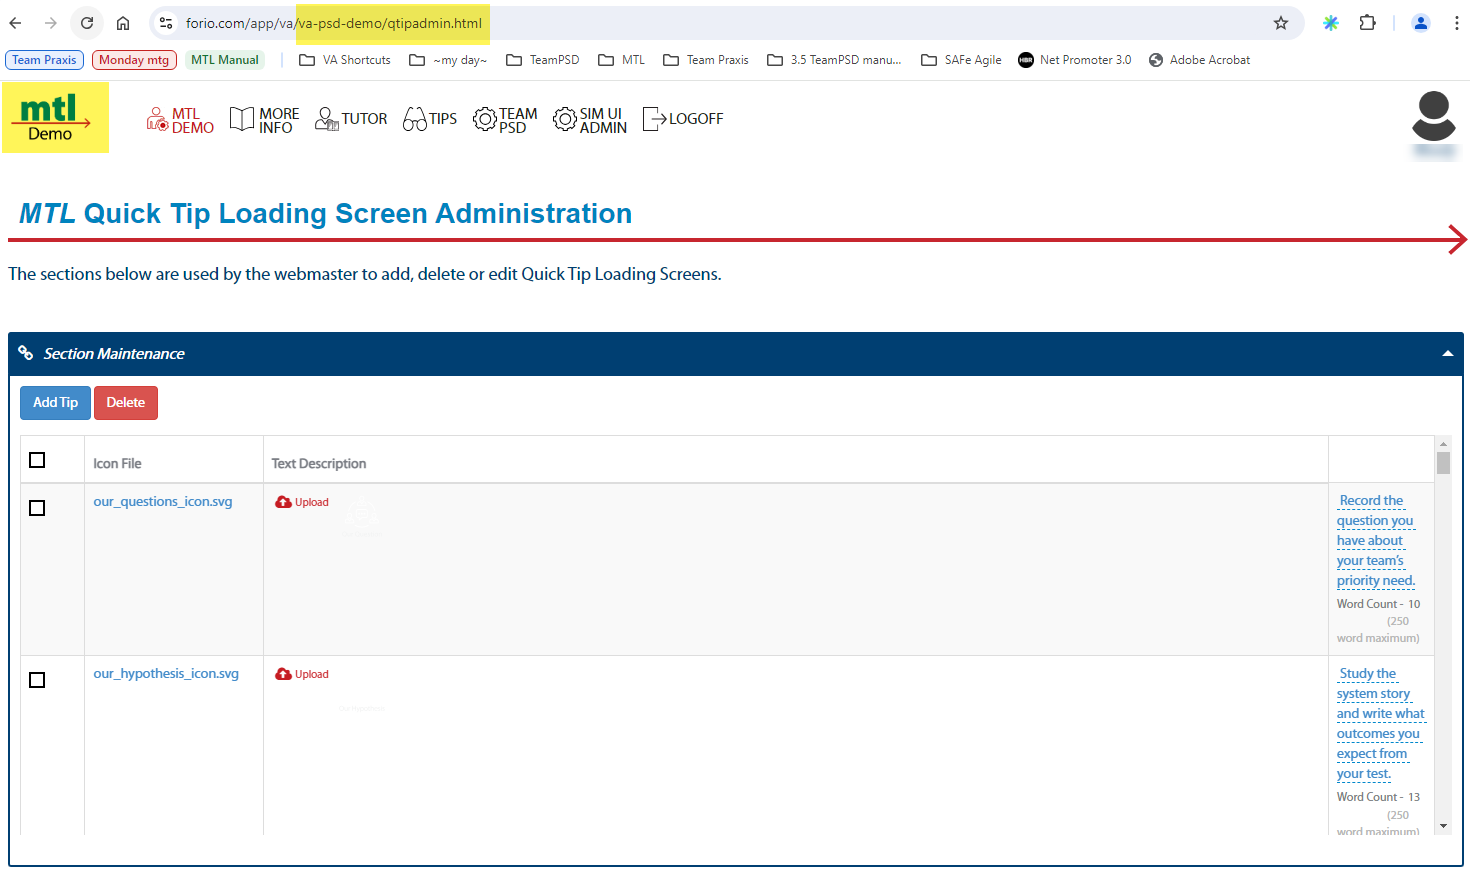
Note: The steps to add, update, or delete quick tips are the same for the Sim UI and MTL Demo.
Verify you are on the right page by looking at the URL. It will say “va-psd-sim/qtipadmin.html” if you are in PROD Tips and “va-psd-demo/qtipadmin.html” if you are in the DEMO Tips.
| Demo Tips Page | Sim UI Tips Page |
|---|---|
 |
 |
3.3.6.5.1 Add a Quick Tip
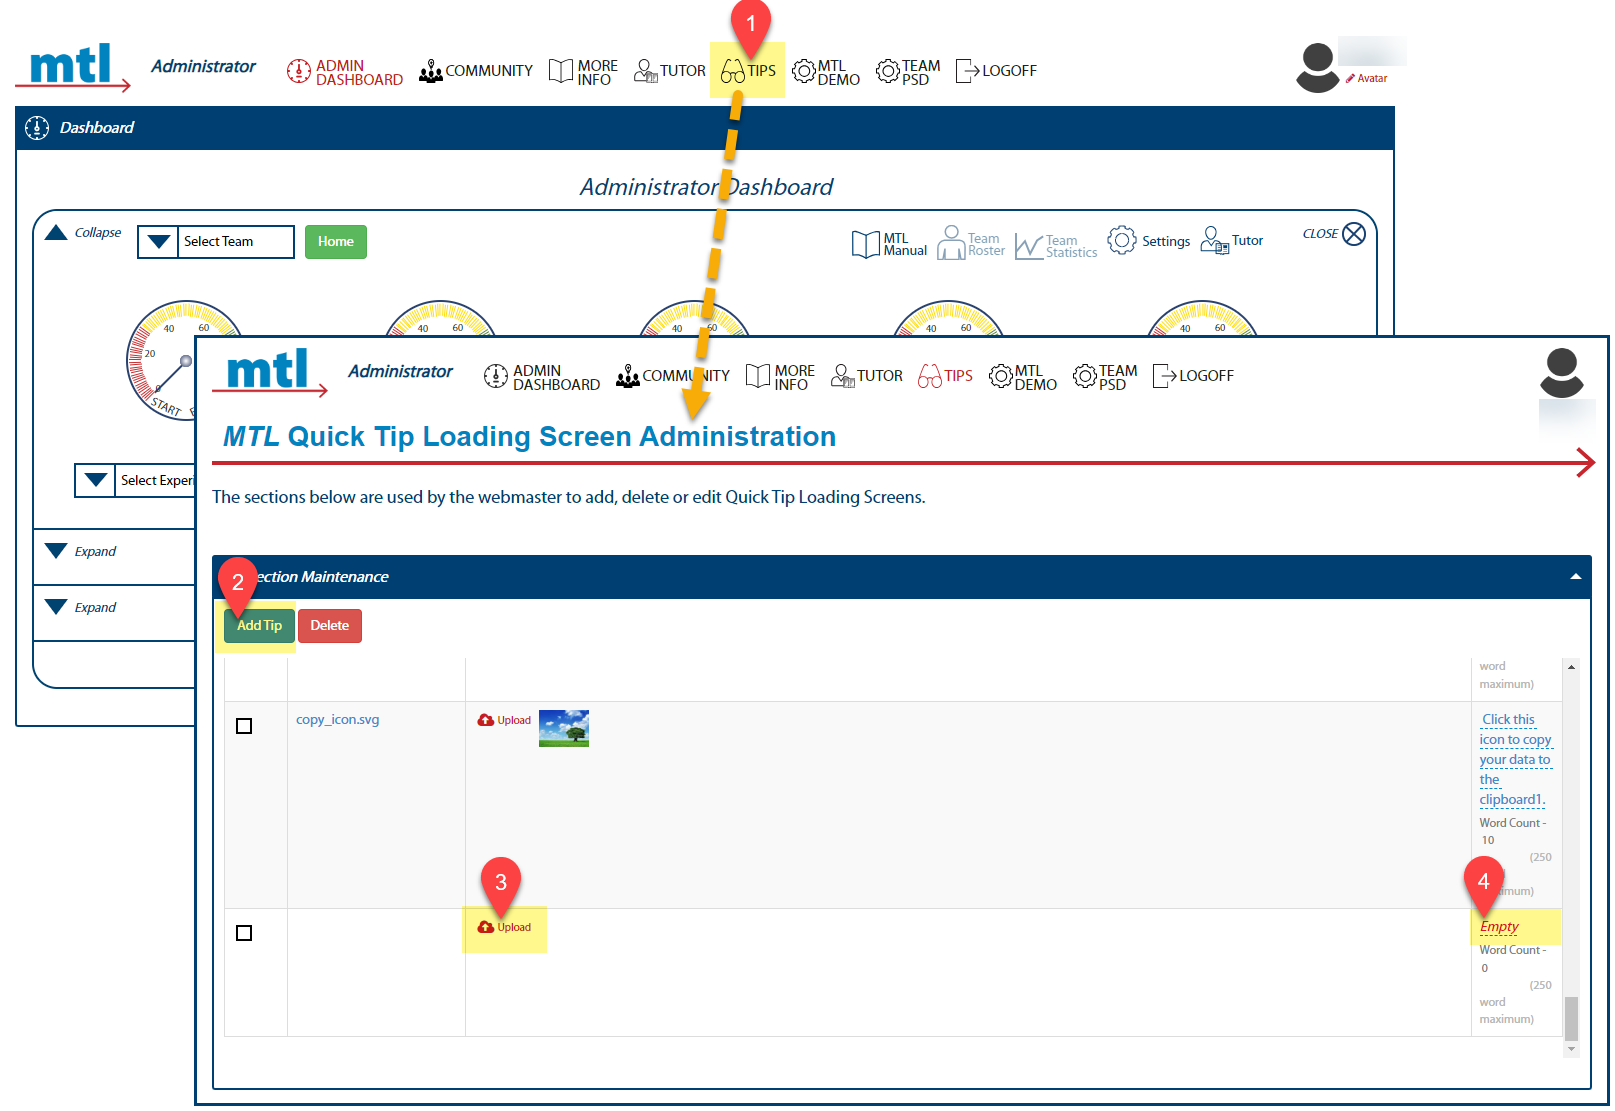
- From the Administrator Dashboard, click on the “Tips” icon. The MTL Quick Tip Loading Screen Administration page will open.
- Click the “Add Tip” button. The page will scroll to the bottom of the list and present a new row to input information.
- Click on the “upload” icon. An upload file pop up will appear. Navigate to your file and click “Save.” The filename should appear immediately to the left of the upload icon and a thumbnail should appear to the right.
- Click on the “Empty” text. A text field will present. Type in the description and click save (the blue checkmark). You are finished!
- Be sure to upload the .svg graphic you used to the lzim/mtl/images/quick_tips_files folder.
3.3.6.6 Manage MTL Demo Webpage
The MTL Demo webpage provides interested users access to a demonstration simulation. The webpage also offers information about the research project, associated training and video materials, and highlights partners that had a hand in its development. The admin website enables the admin to adjust webpage content and demo users.
3.3.6.6.1 MTL Demo Webpage
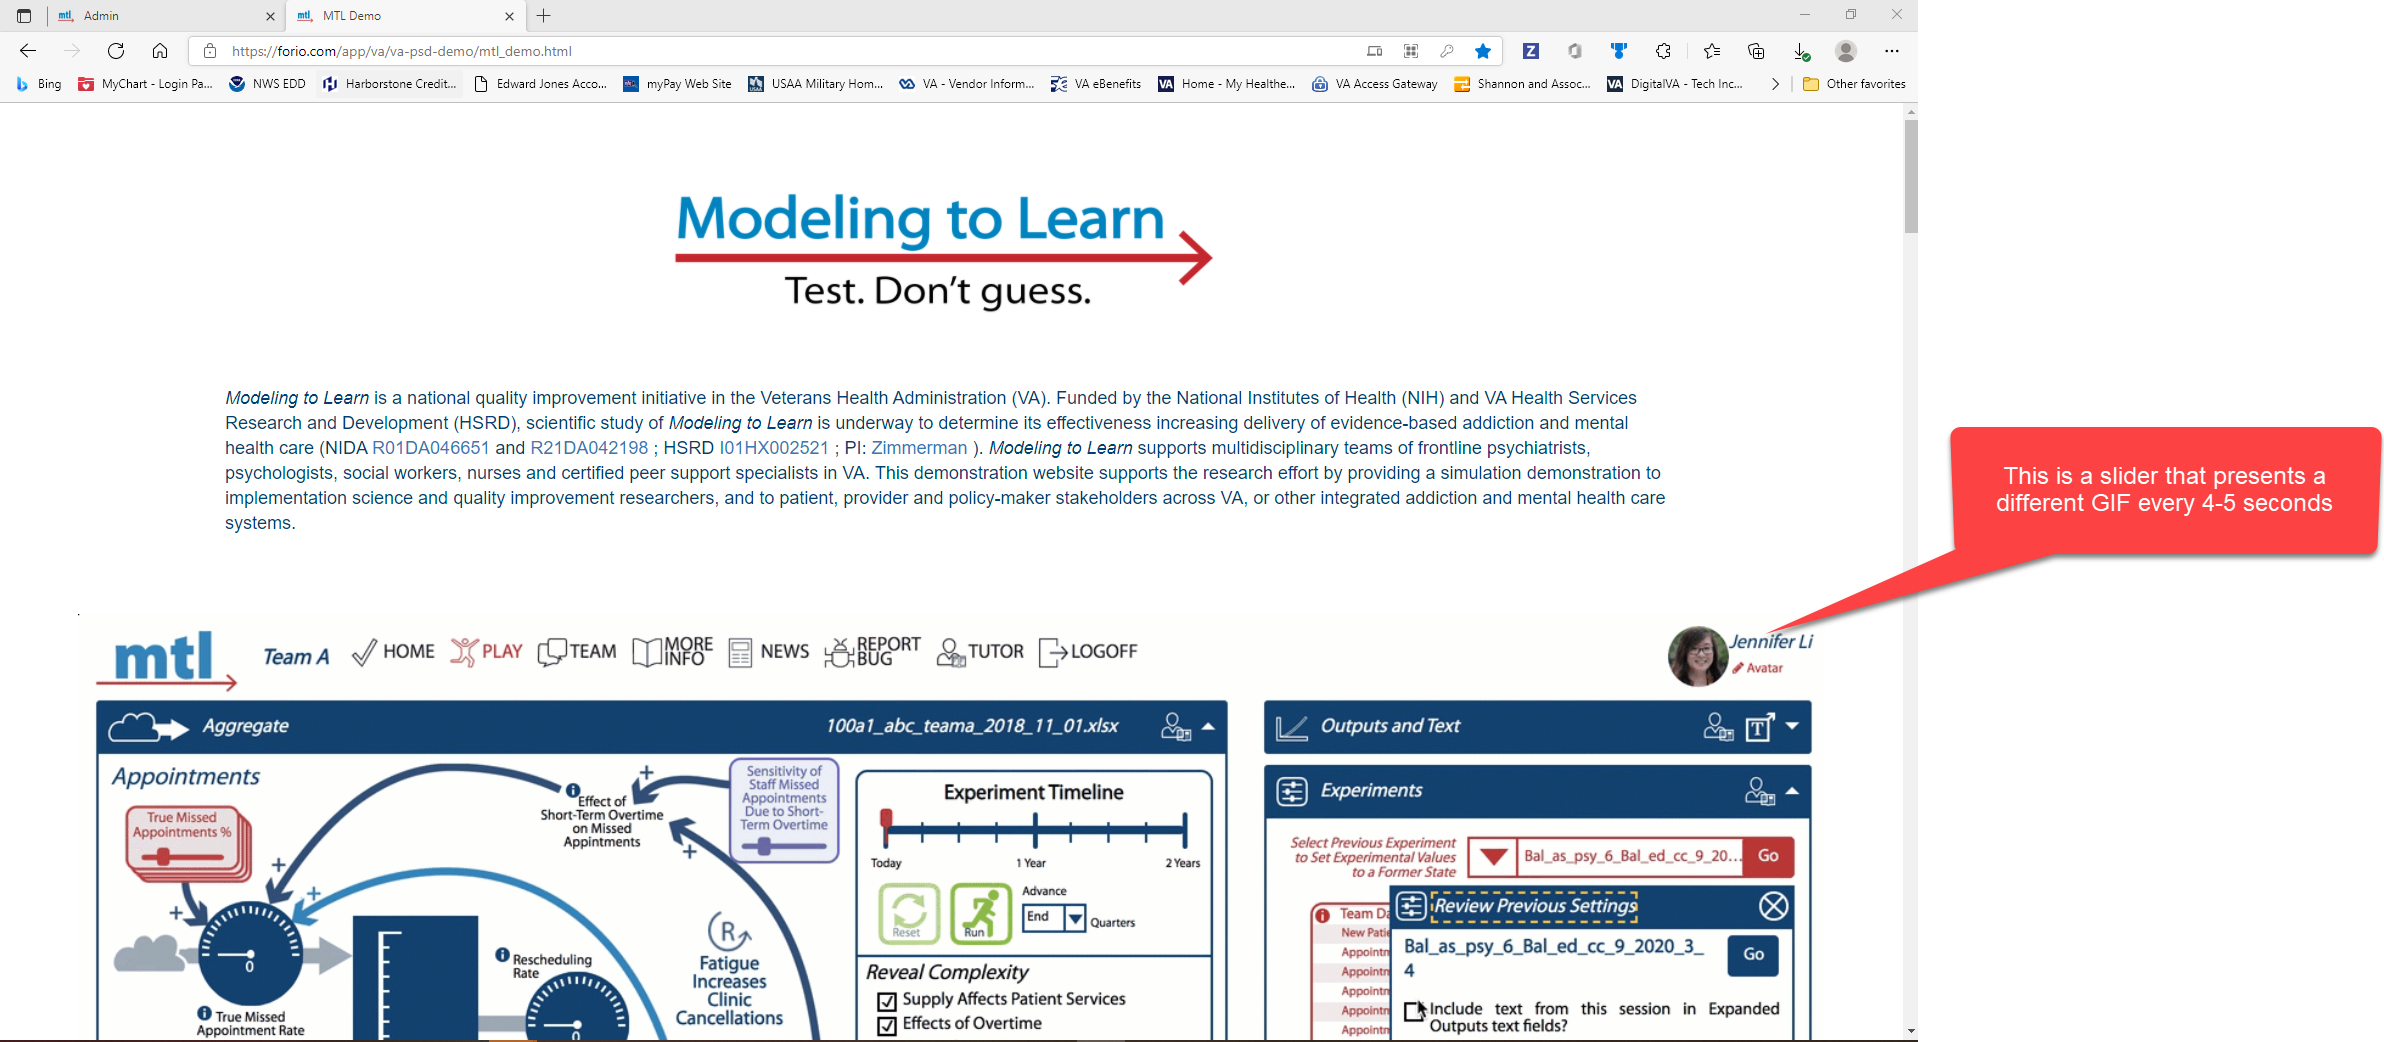
Navigate to MTL Demo to view example below.
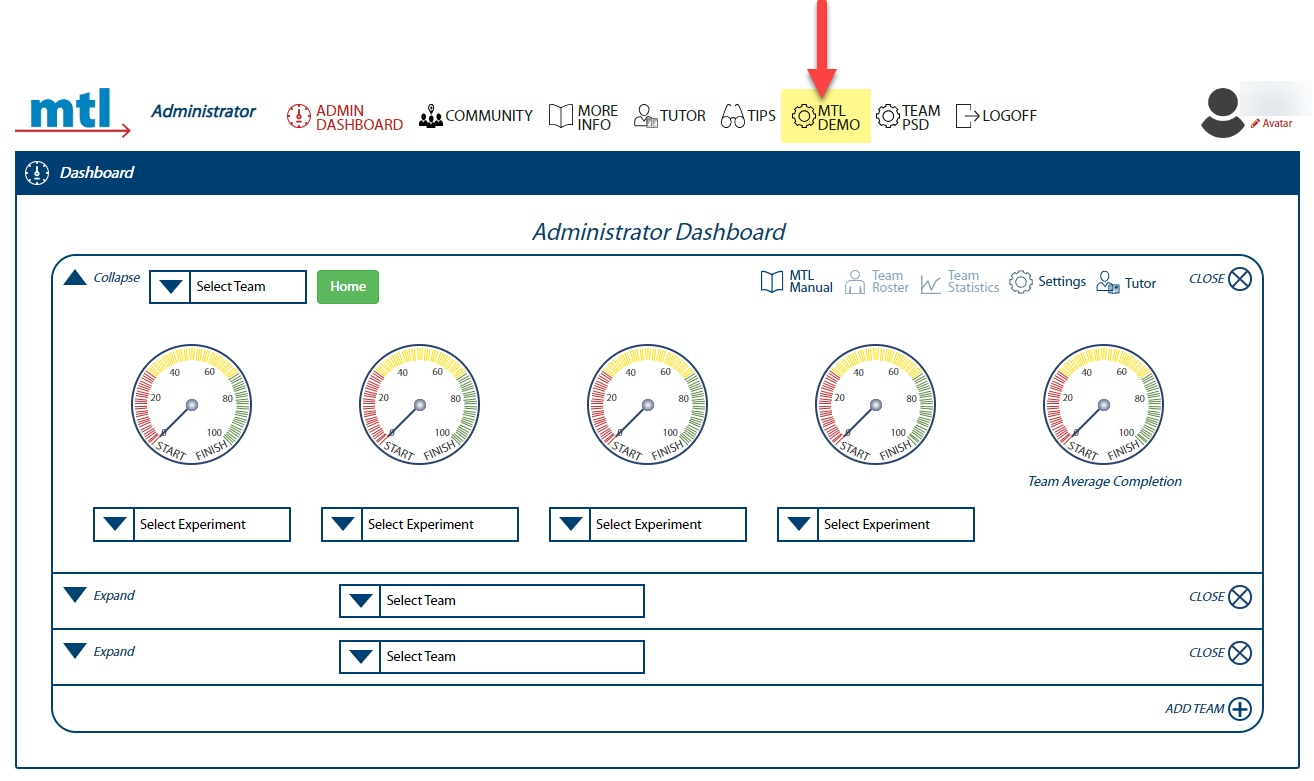
To modify this webpage, click on the MTL Demo icon from the Administrator Dashboard.
3.3.6.6.2 Orient to the MTL Demo Admin Webpage
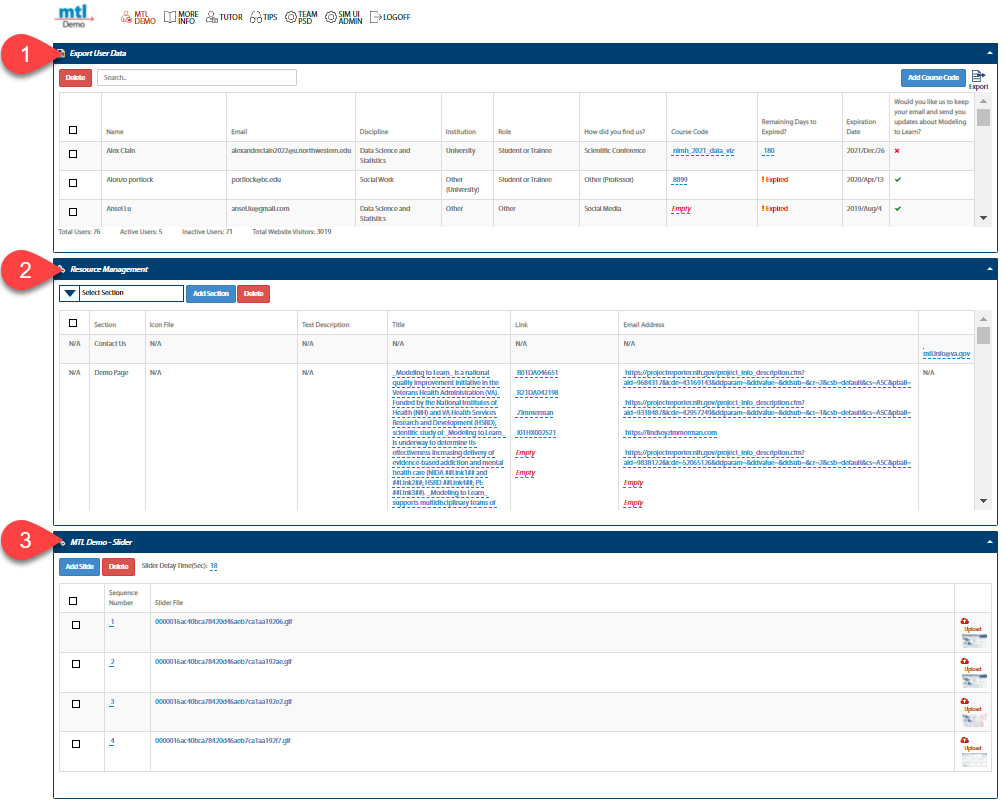
- Export User Data section lists users that have registered for access to the MTL Demo simulation. It lists their names and contact information. The typical registration is for 14 days. However, with a Course Code, the length of the registration can be longer. A user’s access time can be improved, but it must be done before the original date expires.
- Resource Management section manages the information contained on the MTL website. The sections supported are Run, Videos, Slides, Papers, and Funding.
- MTL Demo - Slider section is where the GIF slider files are uploaded.
3.3.6.6.3 Add Course Code
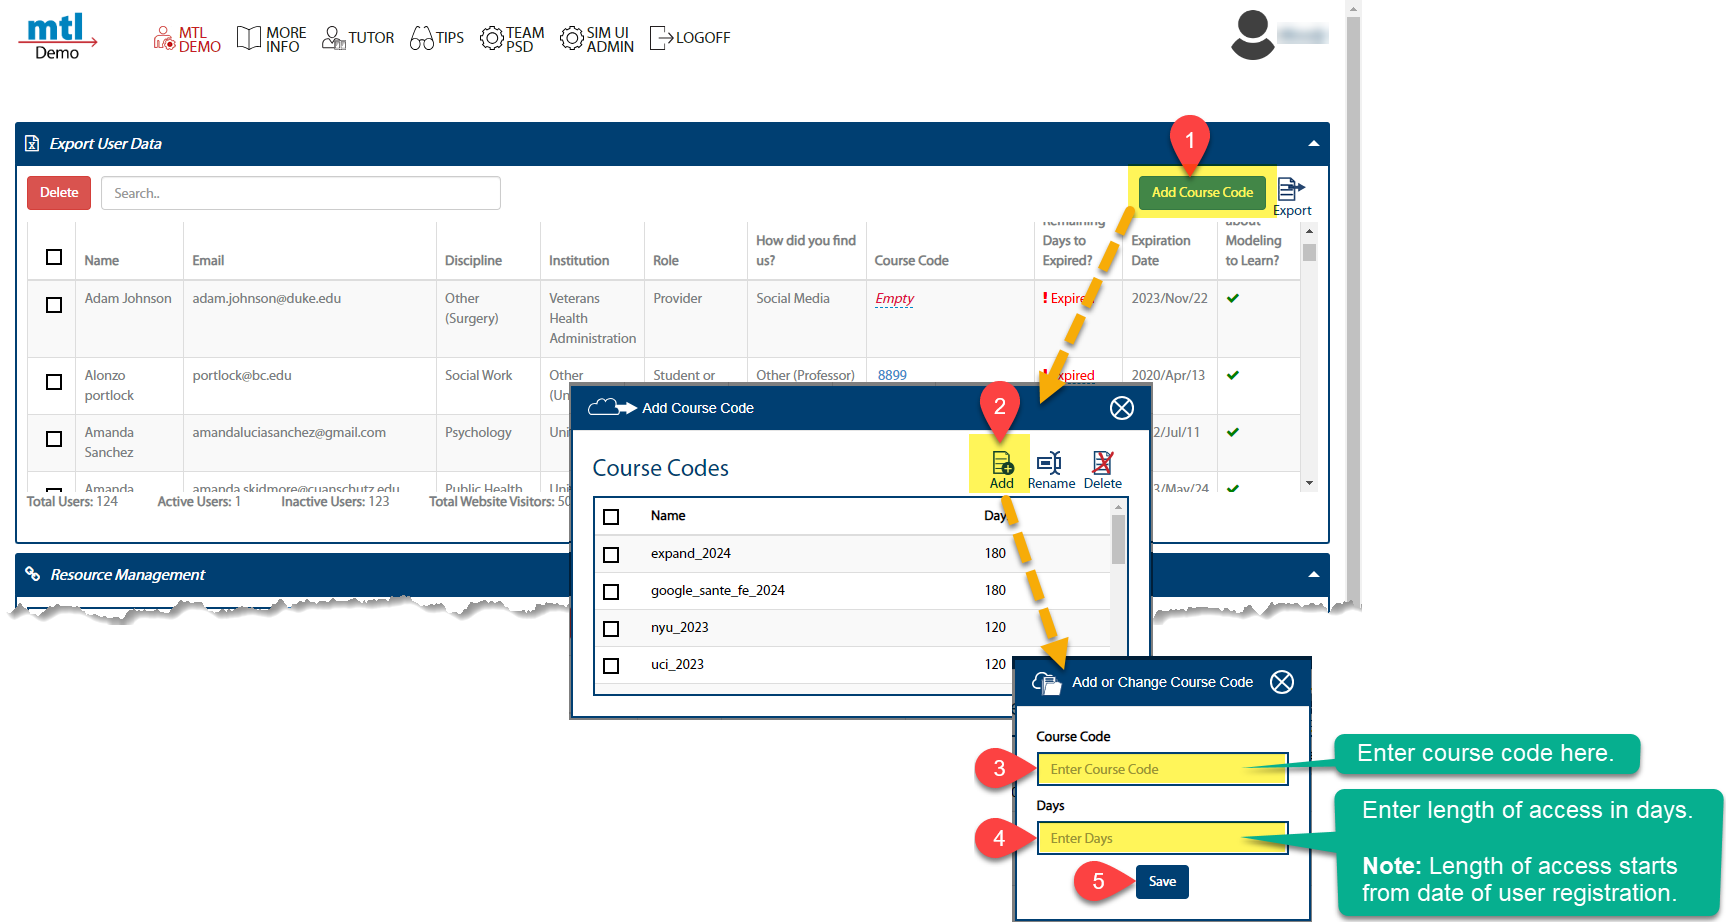
Sometimes we present Modeling to Learn in seminars and other academic gatherings. To enable participants to experience MTL, we provide a course code that enables users to access the platform longer than the standard 14 days.
- From the MTL Demo Admin Webpage, click Add Course Code. An Add Course Code pop-up will appear.
- Click the Add icon. An Add or Change Course Code pop-up will appear.
- Enter the course code.
- Enter the length of access (in days).
- When finished, click Save.
3.3.7 Forio Epicenter
Forio Epicenter is an enterprise platform that hosts our Sim UI and runs the simulations for end users. While the Sim UI can manage most administrator-user needs within the web interface, sometimes it is necessary to go directly into Epicenter to, for example, set up a new end user in Epicenter. Click Epicenter to go to the login.
3.3.7.1 Send Password Reset to End User or Change Password
- Log into Epicenter.
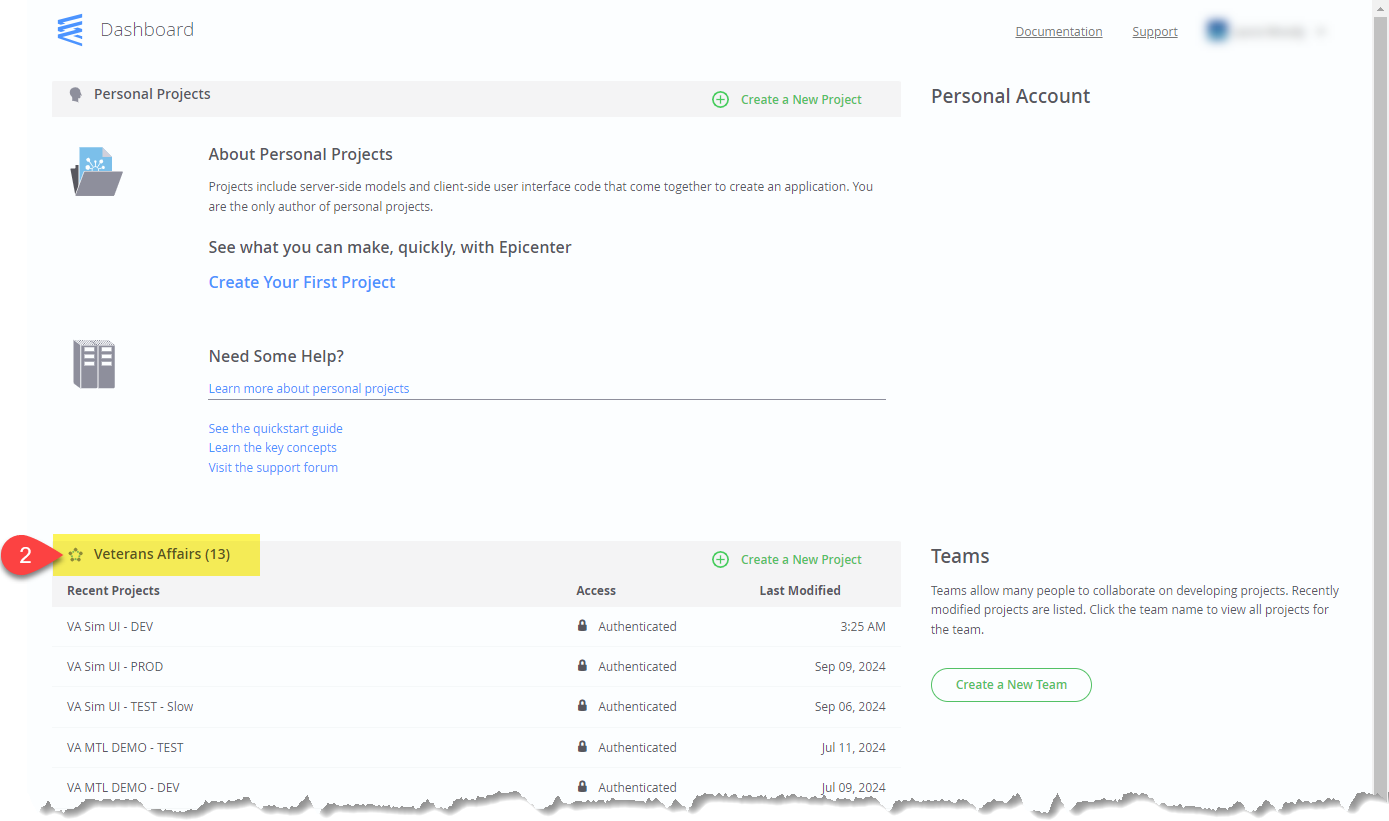
- Click on Veterans Affairs.
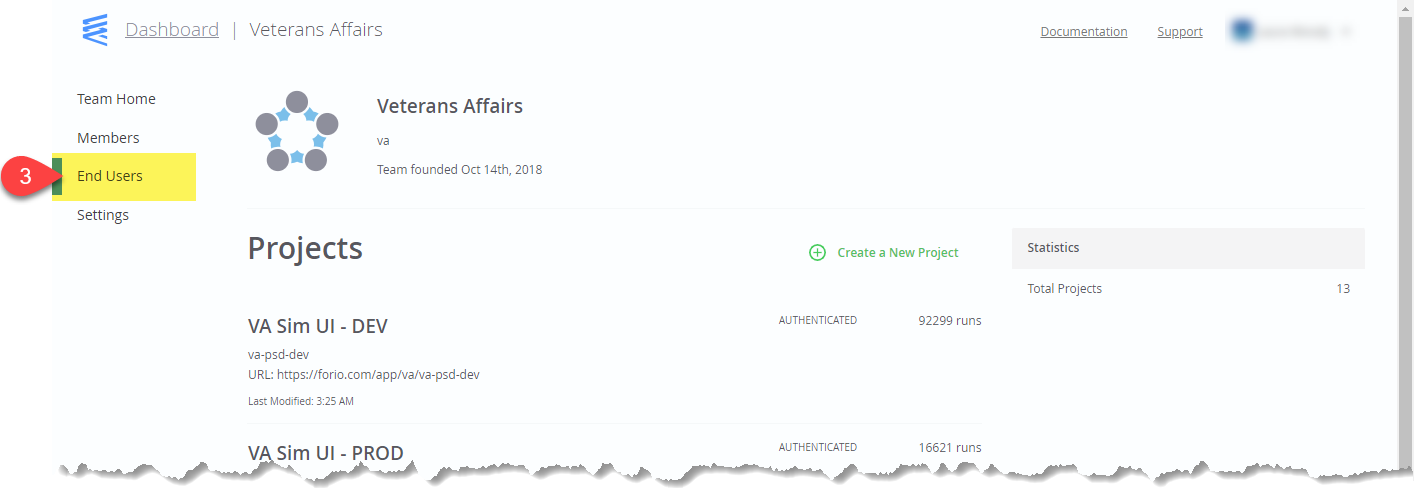
- Click the End Users tab in the side navigation bar.
- Use the search bar to search for a specific user.

- To the right of the selected user’s name, click the Edit button dropdown.
- Click Send Reset Password Link if you want to send a password reset.
- Click Change Password to change the password directly for the user.

3.3.7.2 Setup a New Epicenter End User
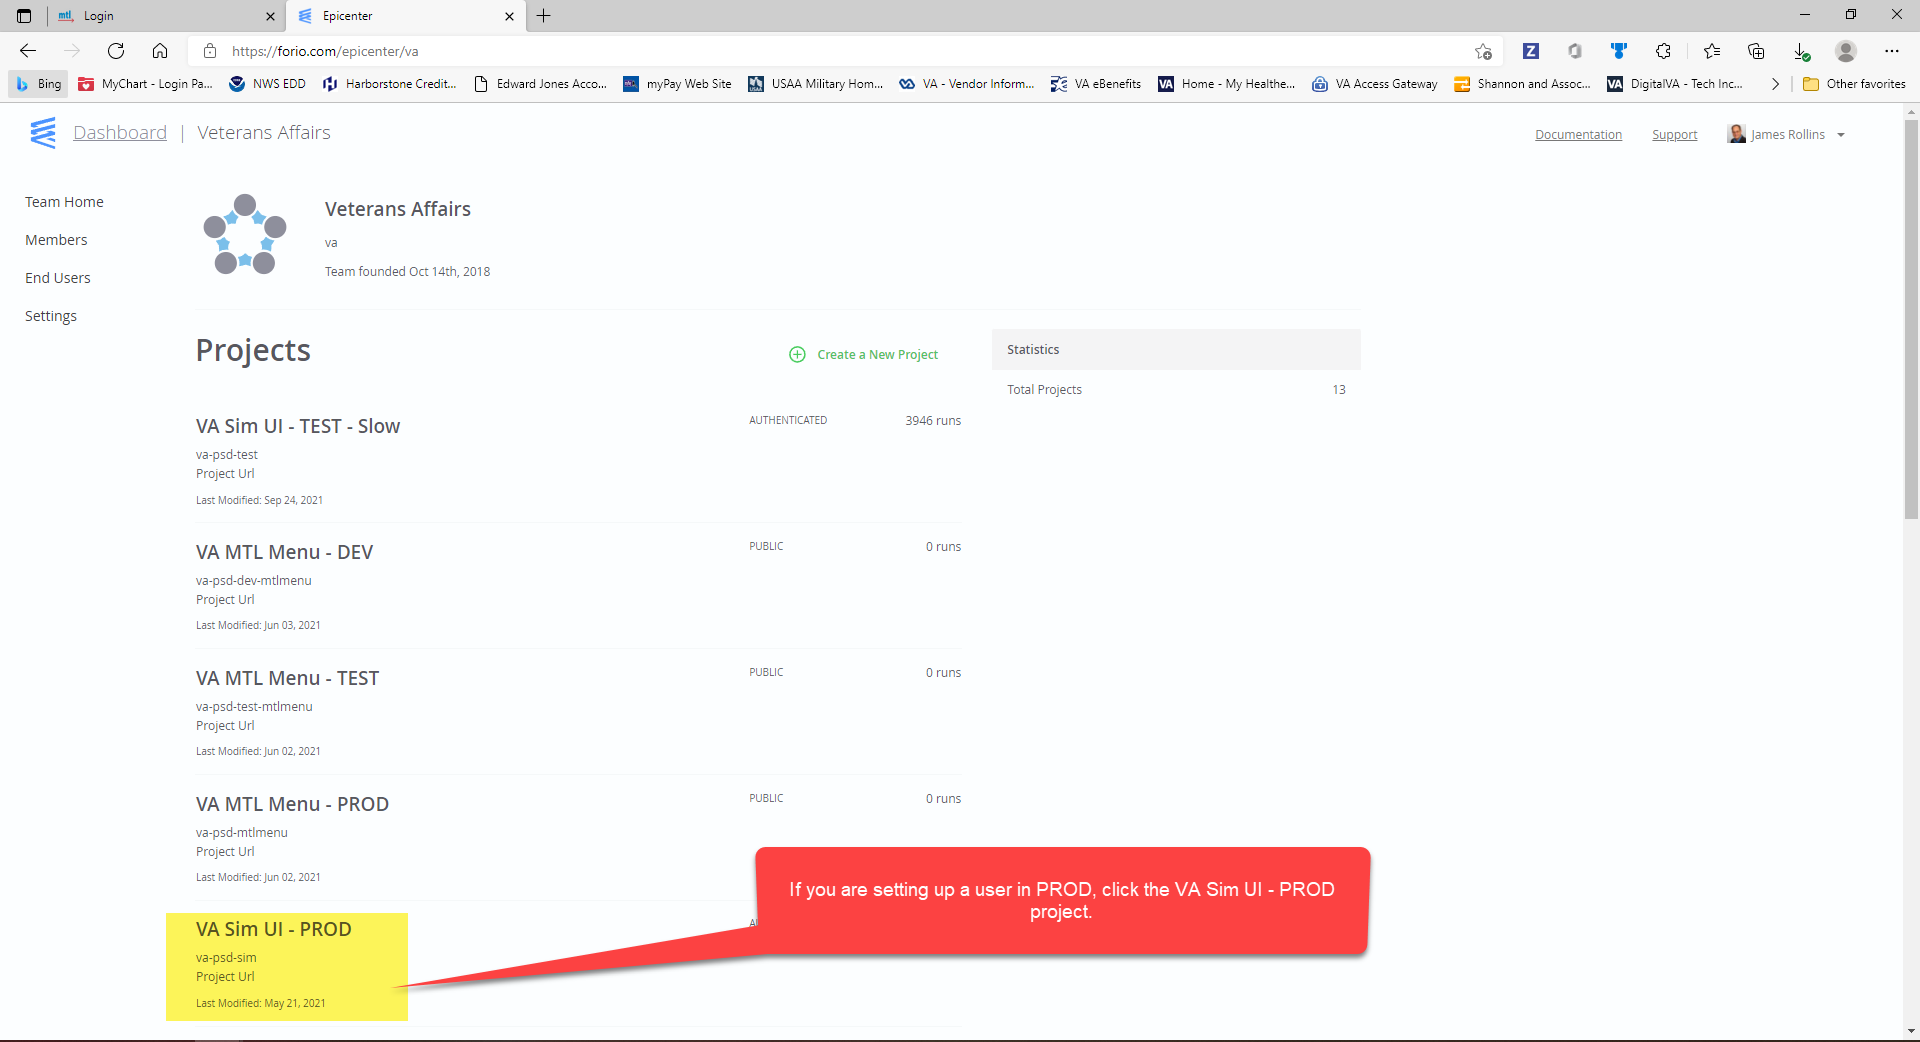
- Navigate to a project.
Note: You would navigate to various projects to set up end users in different instances of the Sim UI. For example, you would navigate to VA Sim UI-TEST-Slow to set an end-user up in the TEST environment.
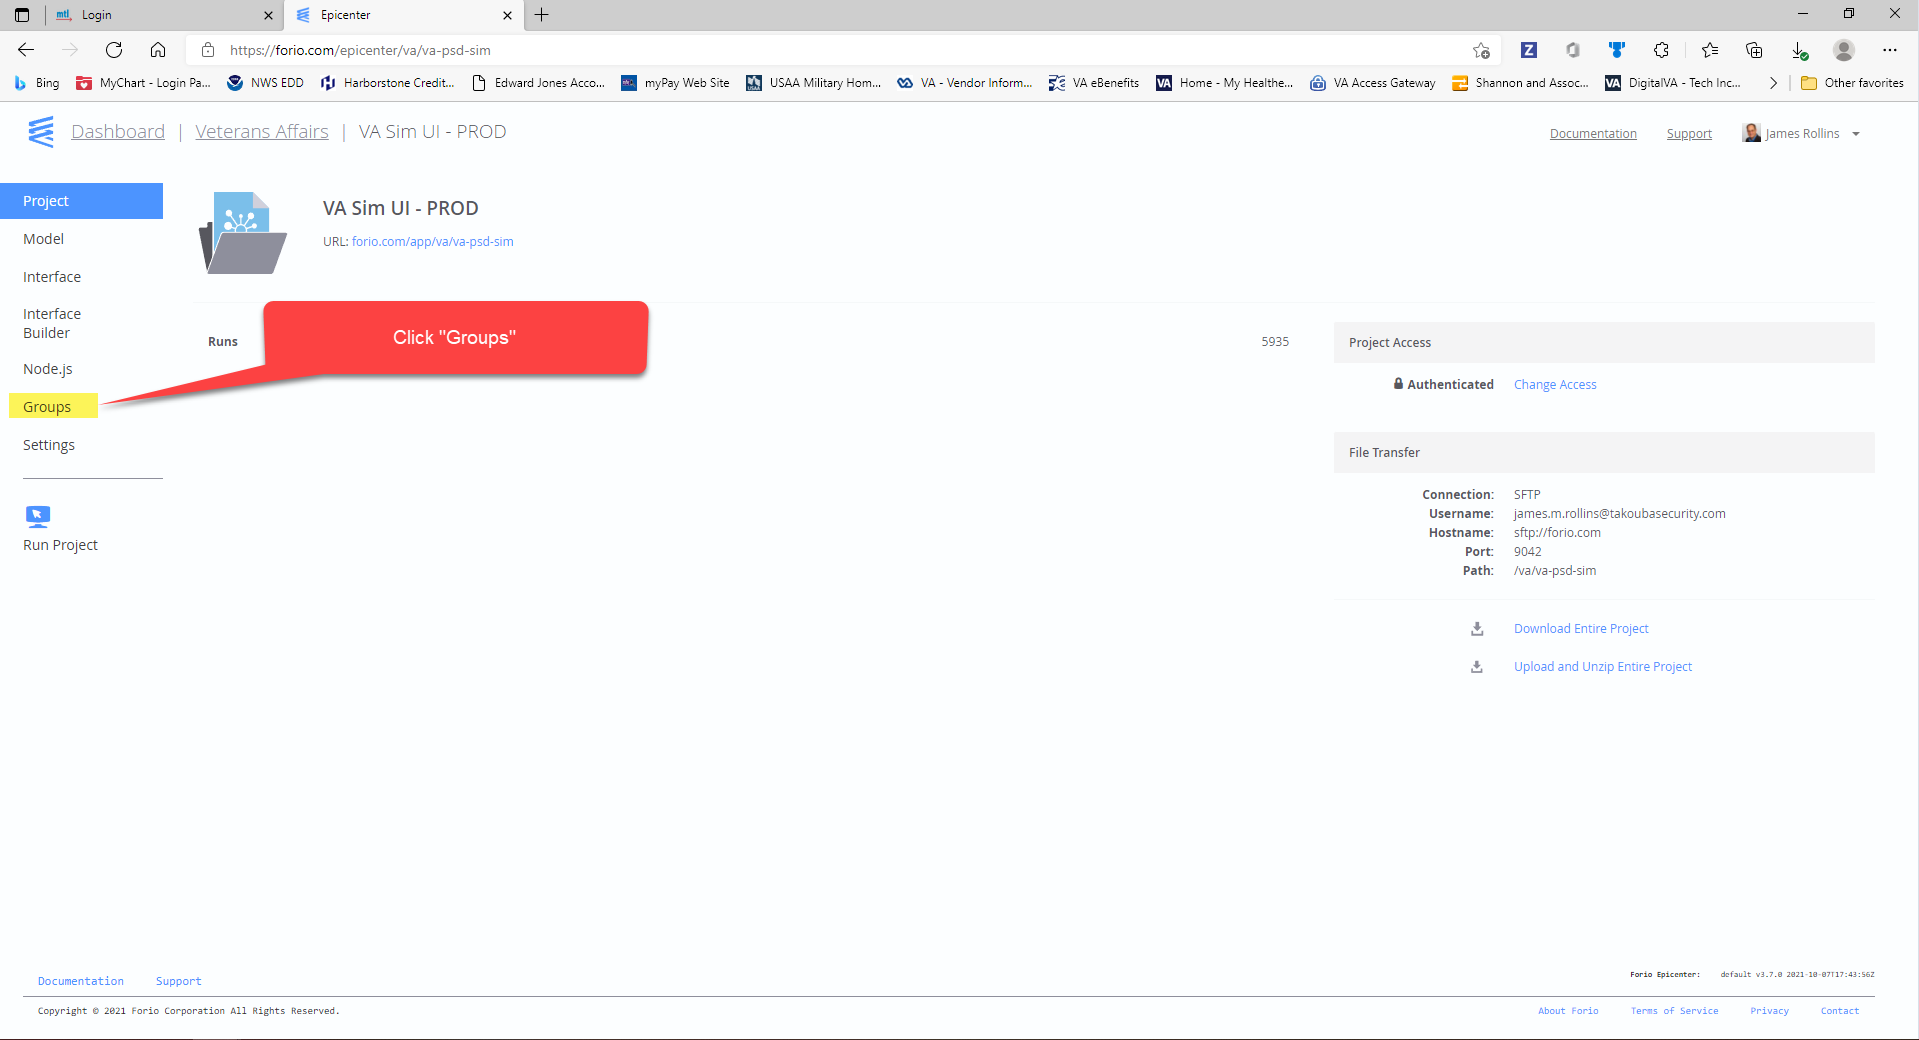
- Navigate to Group page.
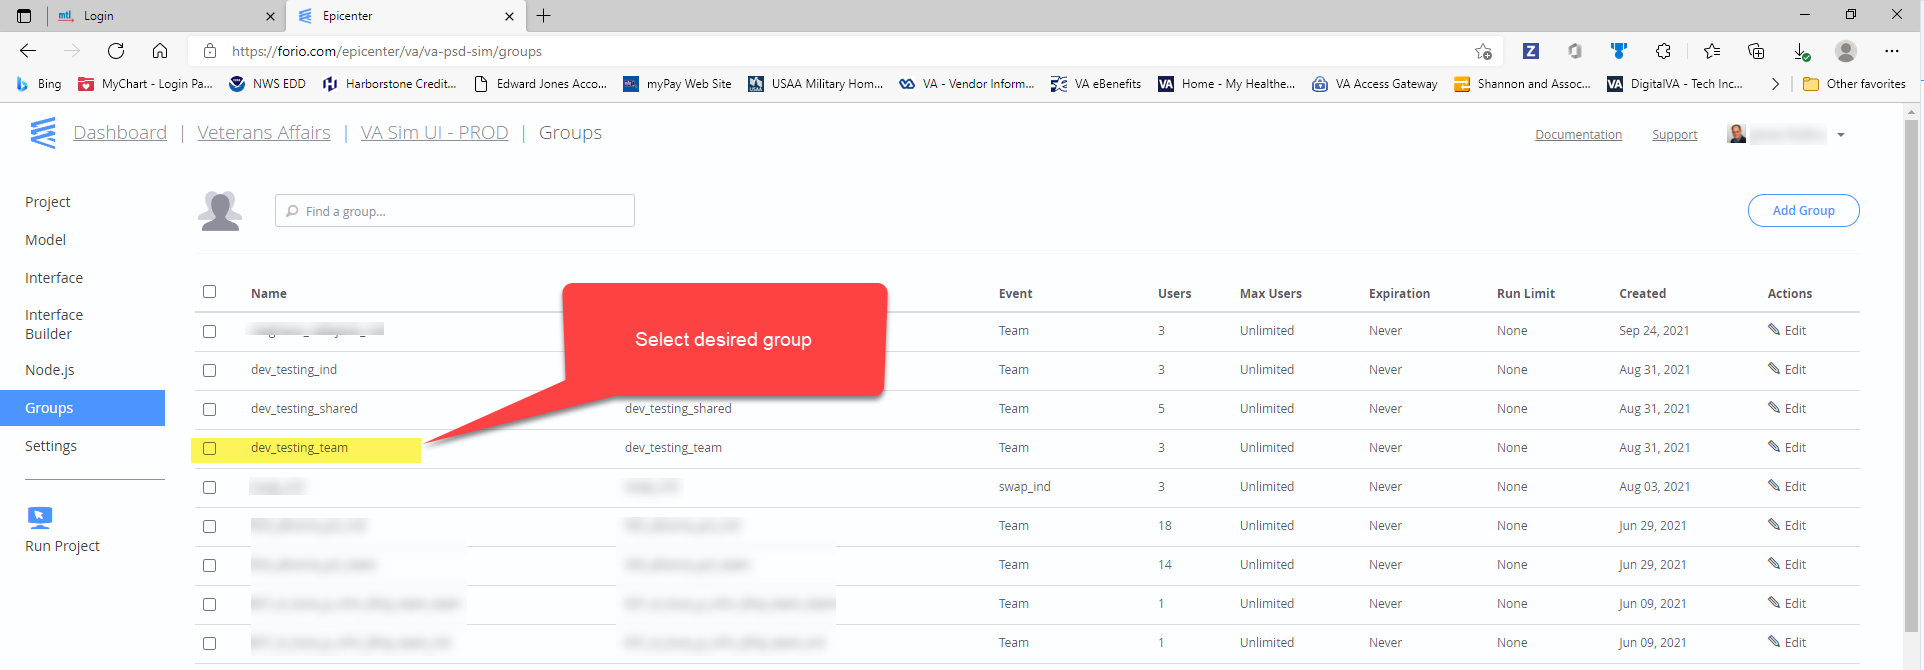
In the Epicenter hierarchy, “groups” are the highest entity. Underneath groups are worlds. In TeamPSD, we refer to groups as “teams.” Typically, we auto-setup a _team group and a _ind group to manage team assignments and individual worlds.
- Select the desired Group.
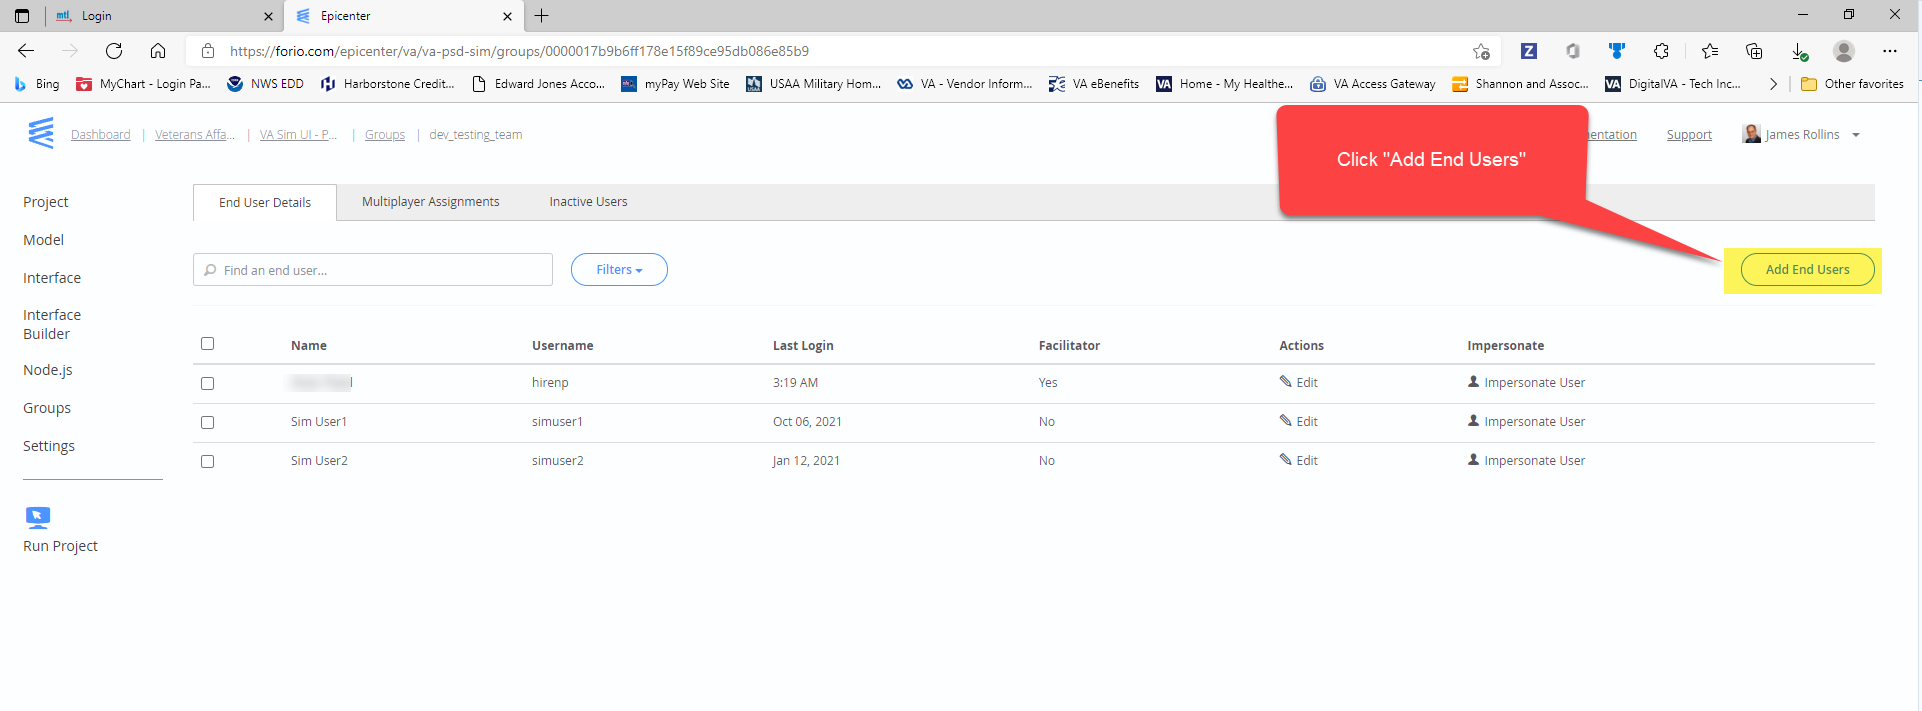
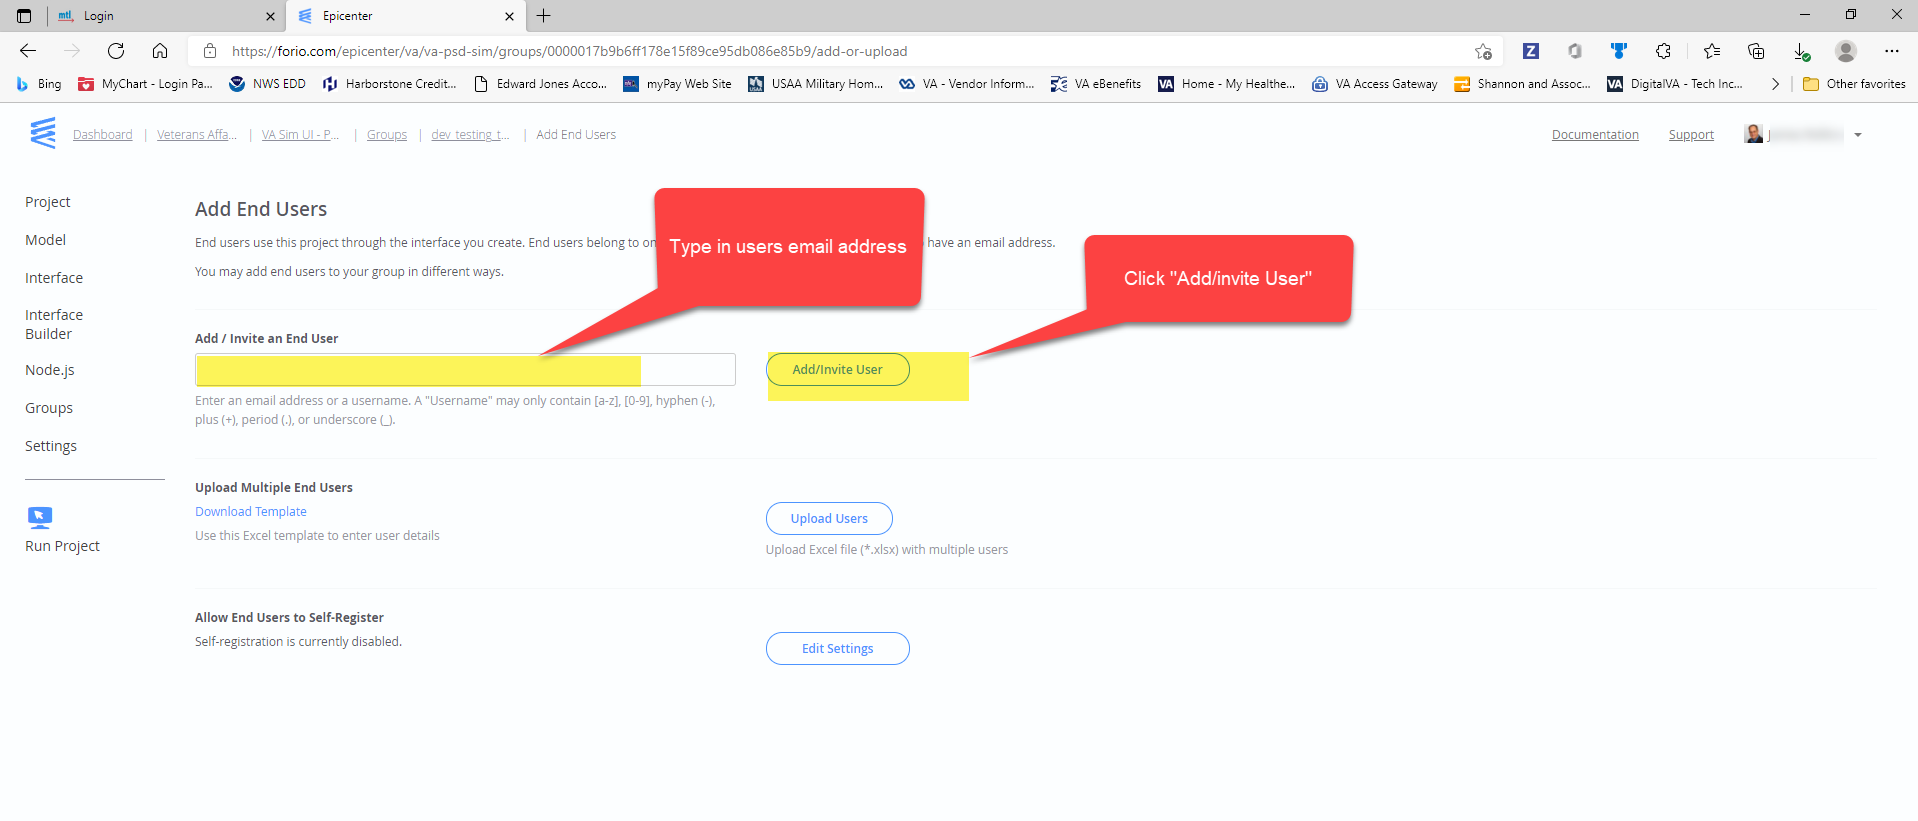
- Click the Add End Users button.
- Add user email to field and click “Add/Invite User” button.
We usually put the user’s VA email address in this field. However, it does not have to be an email unless you are sending a notice via email to the user. Sometimes users just need an alias besides their email address.
3.3.7.3 Setup a Team
We don’t set up teams directly in Epicenter anymore, because there are multiple dependencies in the Sim UI that would be bypassed. See Manage Teams for more information about setting up a team from the Administrator Dashboard.
