Chapter 5 MTL Blue

5.1 Learner
5.1.1 Session 01 See Guide

Note: If you are a self-directed learner, then some of the details in the guides may not apply to you. These guides were developed for facilitated Modeling to Learn Live team meetings.
MTL Live Session 01
Today we’re modeling to learn how to align our team vision.
Done and Do (15 minutes)
| We will begin Modeling to Learn and select a Team Vision for MTL. |
Learning Objectives
Describe your own vision for what you would like your team to get from Modeling to Learn.
Test out your thinking with your team about what your shared vision is for becoming a “dream team.”
Identify a shared team vision for learning from Modeling to Learn.
In-session Exercise (30 minutes)
1. Prior Team Learning Prompt (5 minutes)
Think of a good learning experience in your team. It can be in a meeting or an informal exchange with a colleague. It can be when you learned a clinic procedure, an idea for treatment with a difficult patient, or when a team member unlocked a mystery of CPRS for you. Try to think of a time when you had an ‘aha!’ or something finally made sense, or you could finally do something you couldn’t before.
Jot down on scratch paper what it was that made it a good learning experience. What were the characteristics of the experience? Compile a team list:
- Most likely the following are true:*
- The learning was hands-on and experiential.
- The learning connected to the real world.
- The learning experience was personally relevant, interesting, useful, or meaningful to the learner.
- The learner had choices, shared authority, control, and responsibility.
- The learner learned from and taught others.
- The learner had the support he or she needed.
- The learning was individualized. If there were standards for the work, the learner could meet them in his or her own way.
- It was fun or left the learner feeling good.
- The experience helped the learner understand him- or herself.
- The learner experienced success and accomplishment with challenging work.
2. Best Case Scenario (5 minutes)
Create team language for learning, aligning team decisions when there are roadblocks to consensus. Start by picturing Veteran mental health care in this team as you experience it now – the interactions/communications within the team in and out of team meetings; the key people you rely on outside the team; the information and data you use to coordinate care plans, and the feelings you associate with it.
Now picture the team learning over the next 6 months in a ‘best-case’ scenario, where things are happening in the team the way that you would ideally like them to. This is your “dream team” situation.
3. Personal Vision (5 minutes)
What is team communication like?
How do team members relate to one another?
How is VA data used?
How are decisions, plans and changes made?
4. Review in Team (5 minutes)
What stands out to you?
Why did we choose these?
What makes them so relevant or important to us?
Can we address them all (bearing in mind our resources and time)?
If not, which would we most like to address (align around), and why?
5. Putting it Together (10 minutes)
Overall “Modeling to Learn” objectives include activities and competencies that:
Are meaningful for you and align your learning goals with your team’s.
Develop systems thinking skills - help you see how several things fit together and understand causes that are hard to see without data and modeling resources.
Make VA data, initiatives and standards transparent to you.
Empower you to realize ongoing improvements in team quality of care and team quality of work life.

6. Select the Team Vision
Done and Do (15 minutes)
 Select a team lead and email Team PSD to set up our standing team meeting time. Log into mtl.how/data to look at the splash page. Select a team lead and email Team PSD to set up our standing team meeting time. Log into mtl.how/data to look at the splash page. |
5.1.2 Session 02 See Guide

Note: If you are a self-directed learner, then some of the details in the guides may not apply to you. These guides were developed for facilitated Modeling to Learn Live team meetings.
MTL Live Session 02
Today we’re modeling to learn how to check our patient data and team trends.
Done and Do (15 minutes)
 We identified our Team Vision, selected our Team Lead and set a standing team meeting time. We logged in to mtl.how/data to look at the facility data. We identified our Team Vision, selected our Team Lead and set a standing team meeting time. We logged in to mtl.how/data to look at the facility data.  MTL 2.0. For MTL 1.7, click here MTL 2.0. For MTL 1.7, click here |
We will confirm and review Team Data for MTL relevant to our Team Vision.  MTL 2.0. For MTL 1.7, click here MTL 2.0. For MTL 1.7, click here |
![]()
Learning Objectives
Describe the decisions your team made in producing your team data table.
Test whether team historical trends shown in the “viz” tabs reflect your expectations.
Apply your clinical expertise to identify new information about a team patient in the “data” tabs.
In-session Exercise (30 minutes)
MTL on BISL
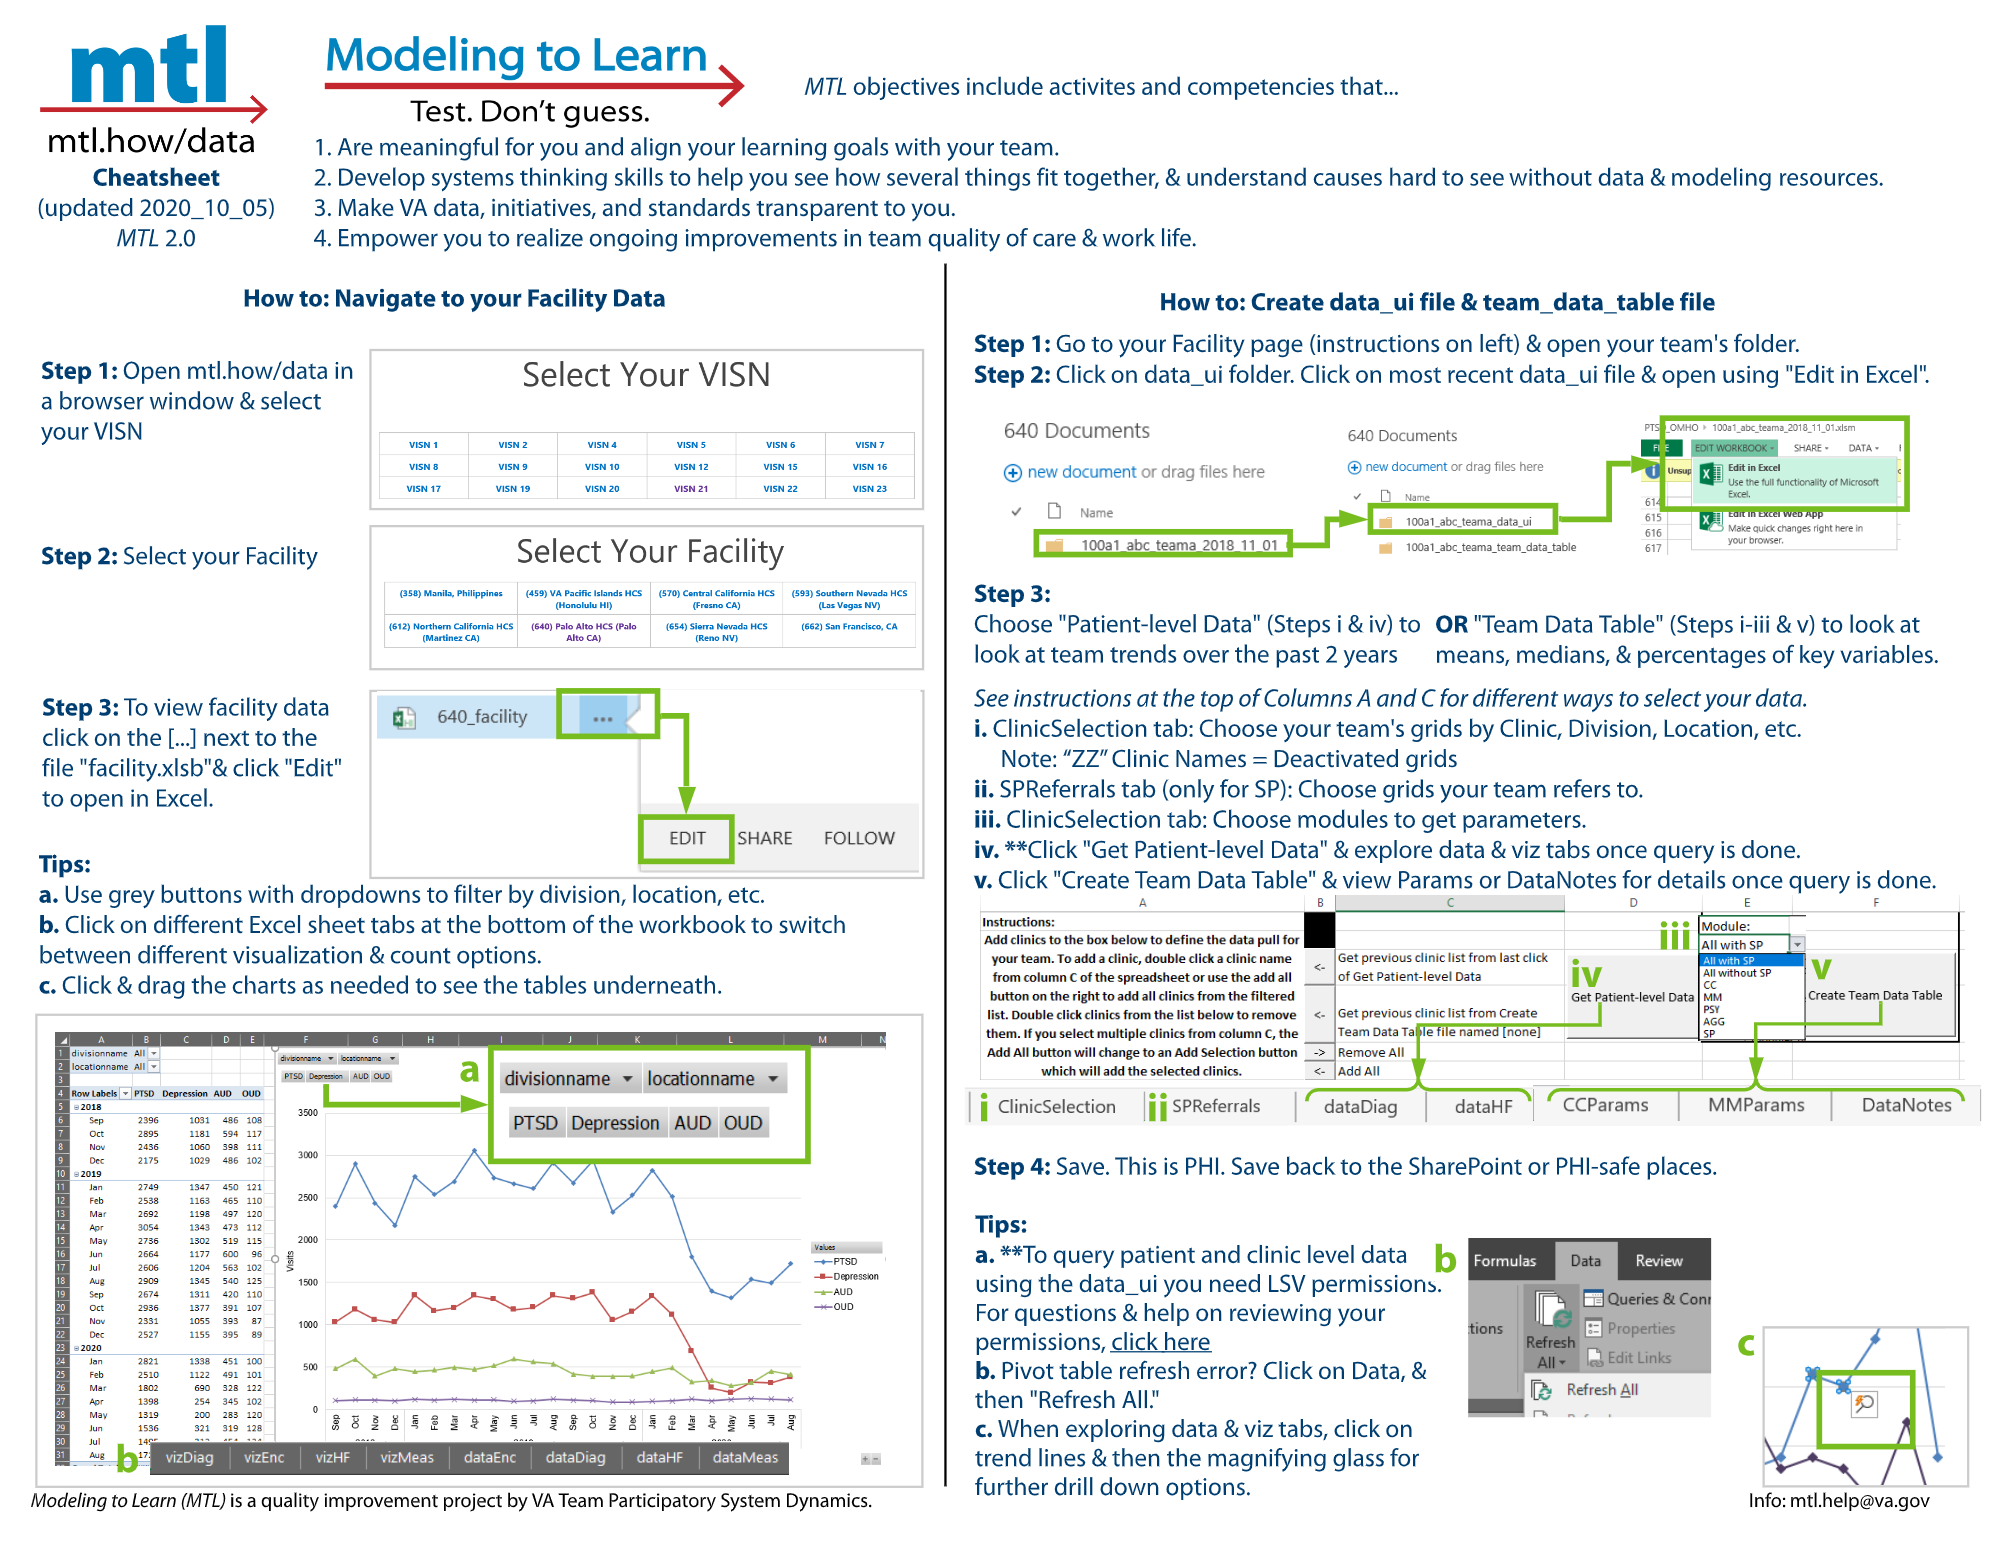
1. Open an internet browser window. Go to mtl.how/data. First select your VISN and then select your facility.

MTL 2.0. For MTL 1.7, click here
2. Explore the facility data.
- To view facility data click on the […] next to the file “facility.xlsb” and click “Edit” to open in Excel.
- Team files are in team folders. If you do not see a team folder, click on "Request New Team Folder in the horizontal header next the BISL logo.

MTL 2.0. For MTL 1.7, click here
- Click through the tabs on the bottom of the Excel spreadsheet. What options are there and what do they mean? Hints:
- Data: Sortable report of data
- Diag: Diagnostic data
- Enc: Encounter types of visits
- HF: Health Factors data related to visits
- Meas: Measures or flag names
- Viz: Visualization of trends
- What filtering options are available?
- Filter to your clinic or division to see trends for the last two years.
New for MTL 2.0
You no longer need to use only Internet Explorer or Edge to open mtl.how/data. You can use any browser.
View facility data via the “facility.xlsb” Excel sheet instead of the splash page.
vizDiag shows unique visits by primary diagnosis on the visit of PTSD, Dep, OUD, or AUD.
Patient SSID is no longer asterisked out in the facility data. It has been completely removed. Please go to the data UI to see Patient SSID information.
NOTE: Refresh your data if you are experiencing issues or discrepancies within the data and filtering facilities/clinics.
- To refresh your facility file’s data, right click on any tab at the bottom of the Excel spreadsheet and select “Unhide…”.
- In the “Unhide sheet:” dropdown, select “Control” and click “OK”.
- In the “Control” tab, select your VA facility’s station number in the “Station:” dropdown and click “Refresh”.
- Do not worry if you see your Excel worksheet become unresponsive as the data is refreshing and will take about 1-2 minutes to complete.
- Warning: Do NOT click “Propagate” as this is used by our data team to update facility data across the nation.

Your Team Data Folder
3. Scroll to your team folder at the bottom of the page. Open the data_ui folder and open your data_ui file in Excel.
- Click on the 3 dots […] next to the data_ui file.
- Click on “Edit” to open in Excel, then click “Edit Workbook” at the top of the sheet.

4. Go to the ClinicSelection tab. Use columns C-H to select the clinics that make up your team.
- You can sort and filter by Clinic Name, Division Name, Physical Location, Primary Stopcode, Secondary Stopcode, and Default Provider.
- Note: This will pull all clinics used in the last two years, including de-activated clinics (denoted by a “ZZ” prefix). You can also see the de-activated clinic’s inactivation date in column I.
- Follow the instructions in Box A2.
- After filtering, click the “Add All” arrow in column B (Cell B6). Fine-tune your selections by double-clicking on the clinic name in column A (to remove) or column C (to add).

New for MTL 2.0
- In the future, if you want to quickly get the same list of clinics again, you can select the grey “Get previous clinic list from last click of Get Patient-level Data” arrow in Column B (Cell B3).
For MTL 1.7 click here.
5. To view your team patient data and your team trends click “Get Patient-level Data.” We will not do this in-session today.
- You already have a fresh data UI file to work with in your team data_ui folder.
- We will learn about the “Create Team Data Table” button in our next team meeting.
- To query patient and clinic level data using the data_ui, you will need LSV permissions. To check which facilities you have LSV access for, click here (VA intranet link to access verification).
- If you don’t have access to facilities that you believe you should, please verify:
- CPRS access/permissions at your station (i.e COR tab access for CPRS).
- Your network username recorded in VistA. To have your network username recording in VistA, please follow the instructions outlined here (VA intranet link to Vista).
New for MTL 2.0
- “Create Team Data Table for Sim UI” is now called “Create Team Data Table.”

For MTL 1.7 click here.
NOTE: It takes some time to run a query from your team data UI to the VA Corporate Data Warehouse.
- On average (depending on the size of your team) it may take 15 minutes or so for your team data UI to pull in fresh data, and Microsoft Excel will be unresponsive until the data UI has finished pulling in your data.

MTL 2.0. For MTL 1.7, click here
6. Click to view the “viz” tab, which show team trends.
- There are team trends for diagnoses, encounters, health factor data (e.g., suicide plans, evidence-based practice templates), and measures from Mental Health Assistant.
- What stands out to you?
- What is most important to you to check out first?
- What is most surprising?

MTL 2.0. For MTL 1.7, click here
New for MTL 2.0
Click on any trend line and then “Quick Explore” (look for the magnifying glass). In the “Explore” box, pick the item you want to explore and click “Drill To.” Keep using the Quick Explore to drill until you reach the data you want. To return to the original settings, click on the gray “Reset Pivot Chart.”
The viz tabs will also return to default selections, when you click “Get Patient-level Data” for new data pulls.
Right click on a trend line and filter to hide a selected item or only keep the selected item.
vizDiag in the data UI shows a drill down by diagnoses or combination of diagnoses.

For MTL 1.7 click here.
7. Click to view the “data” tab, which show your team’s individual patient information.
Patients who have requested restricted access to their information have asterisks (****) in Column F (dataDiag, dataHF) or Column E (dataMeas). If you are a VA provider, you can still identify patients from Column G (dataDiag, dataHF) or Column F (dataMeas).
Patient information corresponds to the same categories as the team trends: diagnoses, encounters, health factor data (e.g., suicide plans, evidence-based practice templates), and measures from Mental Health Assistant.
Providers can filter to find specific patients, or produce reports.
New for MTL 2.0
- dataDiag in the data UI has an additional column after “Diagnoses of Interest,” called “Primary Diagnoses”, specifying which diagnosis is primary.

For MTL 1.7 click here.
- What data tab would you use to find out how many current patients on the team are engaged in a specific evidence-based psychotherapy? What column shows you the session number (EBP template) that the patient is on?
- What viz option would you use to see what the most common service encounters or visits are?
- Are there services that have been increasing over time? Are there services that have been decreasing over time?
With the team trends (viz) and team patient (data) information in the data UI, your team can efficiently use team meetings to focus on the interrelated issues of care coordination and team quality improvement.
Done and Do (15 minutes)
| We confirmed the clinics that make up our team for the Team Data UI. |
Review the HF, Diag, Enc and SP tabs in Team Data UI to find a patient (zoom in) and find a team trend (zoom out). Log in to mtl.how/data and look at the two team folders: data_ui and team_data_table. |
5.1.3 Session 03 Say Guide

Note: If you are a self-directed learner, then some of the details in the guides may not apply to you. These guides were developed for facilitated Modeling to Learn Live team meetings.
MTL Live Session 03
Today we’re modeling to learn how to produce team data for simulation.
Done and Do (15 minutes)
| We reviewed the HF, Diag, Enc and SP tabs in the Team Data UI to find a patient and a team trend. We logged in to mtl.how/data and looked at the two team folders: data_UI and team_data_table. MTL 2.0. For MTL 1.7, click here |
 We will produce our team_data_table for the MTL simulation user-interface (sim UI). We will produce our team_data_table for the MTL simulation user-interface (sim UI).  MTL 2.0. For MTL 1.7, click here MTL 2.0. For MTL 1.7, click here |
![]()
Learning Objectives
Describe your team trends over the last two years based on the estimates in the team data table.
Test your understanding of how the team data are estimated by reviewing descriptions and definitions.
Apply your clinical expertise to consider the team trends in the data UI and team data table to identify team priorities for learning.
In-session Exercise (30 minutes)
When you click the “Create Team Data Table” button, it produces a table of descriptive team data.
- We will not do this in-session today. You already have a fresh Team Data Table to work with in your team team_data_table folder.
- Data are means, medians and percentages of key variables likely to influence the team’s priorities for learning from Modeling to Learn.
- There are team data produced for each module of Modeling to Learn.
- Care Coordination (CC)
- Medication Management (MM)
- Psychotherapy (PSY)
- Aggregate team services (AGG)
- Measurement-based stepped care and suicide prevention (SP)
- Select a set of clinics in ClinicSelection tab similar to what you did for the data UI.
- If you want to produce a team data table for the SP module, click on the SPReferrals tab. Use this tab to select clinics that your team refers to/receives referrals from for the Measurement Based Stepped Care and Suicide Prevention module. The data pull will track patients stepped up/down between your team and the one(s) you select. For example, if you are a GMH team, you would select “SMH” in the dropdown for “The clinics selected below that my team refers to are” and add the SMH clinics your team refers to in Column A. Once you have selected referral clinics in the SPReferrals tab, return to the “ClinicSelection” tab.
- Click on the module drop-down to select the module you want and select “Create Team Data Table.”

MTL 2.0. For MTL 1.7, click here
New for MTL 2.0
- The “SPTransfers” tab is now called “SPReferrals.”
- “Create Team Data Table for Sim UI” is now called “Create Team Data Table.”
- In the future, if you would like to use the same clinic selections for pulling new parameters, you can select the “Get previous clinic list from Create Team Data Table file” arrow in Column B (Cell B4).
- You can now generate a team data table for all the modules without SP (called “All without SP” in the dropdown next to the “Create Team Data Table” button), or all the modules with SP (called “All with SP” in the dropdown next to the “Create Team Data Table” button).
- The team_data_table file you generate will automatically be saved into the team_data_table folder. Regardless of the module selection you make, the team_data_table file will include all five module tabs and labels, but will populate zeroes (“0”) for all parameters of modules that were not selected.
- If you include SP in the module selection, three pop-ups will appear for the three possible care settings (GMH, SMH, PC/PCMHI) to indicate the threshold for minimum gap in patient care required for subsequent visit to be considered a new care episode. In general for the (GMH or SMH or PC/PCMHI) setting, how long of a gap in patient care is required for the subsequent visit to be considered a new care episode? Set the threshold below in weeks. The default threshold is 39 weeks (9 months).

For MTL 1.7 click here.
1. Select a module for review
- Find a variable that is important to your team. How is it estimated in this table? What are its units?
- Where can you find even more detailed information about your team data?
- Check out the last two columns. What is the difference between these two columns?
2. Select a second module for review
- Check out the last two columns.
- Find a variable that is important to you team. How is it estimated in this table? What are its units?
- Where can you find even more detailed information about your team data?
3. Are there any team data table values you would like to explore in the team data UI?
- If so, which ones? Open the data UI to examine your question.
4. Does the team see any values in the team data that seem to vary significantly from expectations?
- If so, what is surprising? Does the estimation definition (second to last column, text in red) help you to interpret the variable value?
5. Does the team see any values in the team data that fit your expectations about high priority team needs?
- If so, what are you noticing? In what ways does the team data fit with your day-to-day clinical practice in your team?
MTL 2.0. For MTL 1.7, click here
Done and Do (15 minutes)
| We produced team data table for the MTL simulation user-interface (sim UI). MTL 2.0. For MTL 1.7, click here |
 Find something in the team data table and complete the mtl.how/menu (behind VA firewall) to prioritize your needs. Responses are confidential. Find something in the team data table and complete the mtl.how/menu (behind VA firewall) to prioritize your needs. Responses are confidential.  MTL 2.0. For MTL 1.7, click here MTL 2.0. For MTL 1.7, click here |
5.2 Facilitator
5.2.1 Session 01 Say Guide
Today we’re modeling to learn how to align our team vision.
Hello! I’m ________________ (facilitator’s name) and I’m _______________ (co-facilitator’s name). Today we’re modeling to learn how to align our team vision.
Throughout Modeling to Learn, we will start each session in our Learner See Guide at MTL.HOW, which is what we’re sharing on our screen now. We’ll review what was Done prior to the session and what we will Do in the session, as well as the specific MTL resources that we’ll be using.
In the Session 1 Done and Do table, you can see that for today, we logged in to mtl.how/live for screen-sharing during the team meeting and called in to the VANTS line for audio. Your home base is mtl.how for ALL of the tools and resources we’ll use in Modeling to Learn, so if you ever forget a link or VANTS number or anything, just type mtl.how into your browser.
Our DO for this session is to Launch Modeling to Learn and select a Team Vision for MTL.
Done and Do (15 minutes)
| We will begin Modeling to Learn and select a Team Vision for MTL. |
Learning Objectives
![]()
By the end of this session you will be able to:
Describe your own vision for what you would like your team to get from Modeling to Learn.
Test out your thinking with your team about what your shared vision is for becoming a “dream team.”
Identify a shared team vision for learning from Modeling to Learn.
Let’s get started!
In-session Exercise (30 minutes): Team vision
- We learn best when we seek to accomplish things that matter to us. Today we will clarify what we are trying to accomplish together with Modeling to Learn. This learning process will be something you commit to because it reflects a key part your own vision for care in this team.
- Identifying a shared purpose can be deeply motivating. We want to identify a shared purpose about what we are trying to achieve as a team participating in Modeling to Learn. The team learning goal provides the focus and energy for committing to learning together over the coming weeks. We have limited time, so we want to identify what is most central to team learning goals and connect this to daily team care delivery.
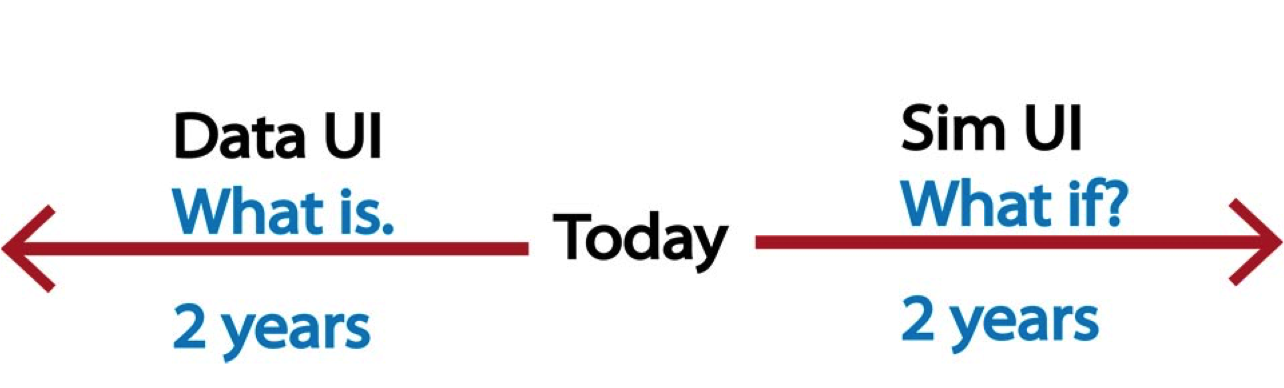
- Team learning is all about ‘alignment’ and getting people working in sync with one another to meet the needs of our Veteran patients. We will explore “what is” (retrospective data) and vision forward to “what we would like it to be” (future-oriented).
- The goal is to move from “my vision” to “our vision” and to shift the paradigm towards how things could be done with shared decision-making. Together, the clinic team lead and facilitation team will explore “What can be done better?” in a way that reflects common team aspirations.
1. Prior Team Learning Prompt (5 minutes)
First, we want to set ground rules for our learning sessions. Think of a good learning experience in your team. It can be in a meeting or an informal exchange with a colleague. It can be when you learned a clinic procedure, an idea for treatment with a difficult patient, or when a team member unlocked a mystery of CPRS for you. Try to think of a time when you had an “aha!” Something finally made sense, or you could finally do something you couldn’t before.
Jot down on scratch paper what it was that made it a good learning experience. What were the characteristics of the experience? Compile a team list.
- Most likely the following are true:
- The learning was hands-on and experiential.
- The learning is connected to the real world.
- The learning experience was personally relevant, interesting, useful, or meaningful to the learner.
- The learner had choices, shared authority, control, and responsibility.
- The learner learned from and taught others.
- The learner had the support he or she needed.
- The learning was individualized. If there were standards for the work, the learner could meet them in his or her own way.
- It was fun or left the learner feeling good.
- The experience helped the learner understand him- or herself.
- The learner experienced success and accomplishment with challenging work.
2. Best Case Scenario (5 minutes)
Now let’s envision our Best Case Scenario. It is important to create a team language for learning; for aligning team decisions when there are roadblocks to consensus. Start by picturing Veteran mental health care in this team as you experience it now. The interactions and communications within the team, in and out of team meetings. The key people you rely on outside the team. The information and data you use to coordinate care plans, and the feelings you associate with it.
Now picture the team learning over the next 6 months in a best case scenario, where things are happening in the team the way that you would ideally like them to. This is your dream team situation.
3. Personal Vision (5 minutes)
Think about your Personal Vision for your team:
What is team communication like?
How do team members relate to one another?
How is VA data used?
How are decisions, plans and changes made?
4. Review in Team (5 minutes)
Reflecting as a team on those individual visions:
What stands out to you?
Why did we choose these?
What makes them so relevant or important to us?
Can we address them all (bearing in mind our resources and time)?
If not, which would we most like to address (align around), and why?
5. Putting it Together (10 minutes)
Putting it all together, overall Modeling to Learn objectives include activities and competencies that:
Are meaningful for you and align your learning goals with your team.
Develop systems thinking skills that help you to see how several things fit together and understand causes that are hard to see without data and modeling resources.
Make VA data, initiatives and standards transparent to you.
Empower you to realize ongoing improvements in team quality of care and team quality of work life.
6. Select the Team Vision
To wrap up, let’s home in on our Team Vision
You can further word-smith the Team Vision after the session if you want.
We’ll hold this vision up as a reminder of our shared goals to orient our learning throughout the MTL program.
That’s it for Modeling to Learn how to align our team vision! Next is our Done/Do review
Done and Do (15 minutes)
| Select a team lead and email Team PSD to set up our standing team meeting time. Log into mtl.how/data to look at the splash page. |
DO Demo
We will help the team decide on a Team Lead and standing meeting time over the next week or two. The role of the Team Lead is to:
be the main point of contact between the team and Modeling to Learn co-facilitators;
help with scheduling MTL-related team meetings;
become familiar with MTL resources and help team members trouble-shoot - mainly mtl.how/live (Adobe Connect, used for screen-sharing during meetings), mtl.how/data (the data user interface), mtl.how/sim (the simulation user interface); and
provide leadership during MTL sessions, encouraging team participation in discussions and serving as computer simulation lead under co-facilitators’ guidance.
Ideal characteristics of the Team Lead include
Having strong relationships with fellow team members;
Being organized;
Having basic computer knowledge (some Excel experience is good);
Attention to detail; and
Commitment to process improvement and the use of data to improve care.
Some considerations for choosing a standing meeting time are
Whether the team works at a central location or is geographically dispersed;
Clinic schedules; and
Clinicians’ availability.
All team members will receive a post-session email the week after each session from the Modeling to Learn staff, with Done and Do reminders and links to the necessary resources; and another pre-session email the week of the upcoming session.
Until next time, thank you for Modeling to Learn!
5.2.2 Session 01 Say Checklist
Today we’re modeling to learn how to align our team vision. - [ ] Hello! I’m __________ and I’m __________. Today we’re modeling to learn how to align our team vision
Navigate to the SEE guide to show Done and Do
![]() _____________
_____________
Time 00:00-00:10
Do and Done (15 minutes)
| ![]() Done |
Done | ![]() Do |
| — | — |
| We joined the Microsoft Teams meeting invitation from Outlook and called in, if needed.| We will begin Modeling to Learn and select a Team Vision for MTL.|
Do |
| — | — |
| We joined the Microsoft Teams meeting invitation from Outlook and called in, if needed.| We will begin Modeling to Learn and select a Team Vision for MTL.|
Emphasize importance of creating a shared team vision while reviewing the learning objectives on the screen
![]()
Learning Objectives
- Describe your own vision for what you would like your team to get from Modeling to Learn.
- Test out your thinking with your team about what your shared vision is for becoming a “dream team.”
- Identify a shared team vision for learning from Modeling to Learn.
Start in-session exercise. Provide clarity on what we are trying to accomplish together with “Modeling to Learn” and the importance of creating a team learning goal.
Goal: to move from “my vision” to “our vision” using shared decision-making. Together, the clinic team lead and facilitation team will explore “What’s can be done better?” in a way that reflects common team aspirations.
Setting ground rules for learning sessions
Write down characteristics of good learning experience
Facilitate discussion on characteristics that were written down
Best Case Scenario
Picture Veteran mental health care in this team as you experience it now. Consider interactions and communications within the team, in and out of team meetings. Think of the information and data you use to coordinate care plans, and the feelings you associate with it.
Next, picture the team learning over the next 6 months in a best case scenario where the team is functioning in an ideal way – this is your dream team situation.
Personal Vision
Personal vision for the team.
Consider: team member relations, team planning and decision-making, use of VA data to inform team care.
Review in Team
Facilitate discussion of individual personal visions for the team.
Identify any themes and those visions the team would most like to address.
Putting It Together
Putting it all together, overall Modeling to Learn objectives include activities and competencies that:
- Are meaningful for you and align your learning goals with your team.
- Develop systems thinking skills and help you to see how several things fit together and understand causes that are hard to see without data and modeling resources.
- Make VA data, initiatives and standards transparent to you.
- Empower you to realize ongoing improvements in team quality of care and team quality of work life.
- Are meaningful for you and align your learning goals with your team.
- Select the Team Vision
That’s it for Modeling to Learn how to align our team vision! Next is our Done/Do review.
Done/Do (15 minutes)
 We selected a Team Vision to orient our learning throughout the MTL program. We will hold this vision up as a reminder of our shared goals to orient our learning throughout MTL. We selected a Team Vision to orient our learning throughout the MTL program. We will hold this vision up as a reminder of our shared goals to orient our learning throughout MTL. |
Select a team lead and email us at mtl.help@va.gov. Log into mtl.how/data to look at the facility file. |
5.2.3 Session 02 Say Guide
Hello! I’m ________________ (facilitator’s name) and I’m _______________ (co-facilitator’s name). Navigating to the Learner See Guide for Session 2 at mtl.how, we see that today we’re modeling to learn how to check our patient data and team trends.
Done and Do
| We identified our Team Vision of _______________ ; selected our Team Lead _______________ ; and set a standing team meeting time at _______________ . We logged in to mtl.how/data to look at the facility data. |
We will confirm and review Team Data for MTL relevant to our Team Vision. |
![]()
Learning Objectives
- Describe the decisions your team made in producing your team data table.
- Test whether team historical trends shown in the “viz” tabs reflect your expectations.
- Apply your clinical expertise to identify new information about a team patient in the “data” tabs.
![]() Done by 00:10
Done by 00:10
In-Session Exercise
![]() 00:10-00:15
00:10-00:15
Participatory Learning from Simulation
This graphic illustrates how Modeling to Learn can help us to get more of our Veterans to the right care in the right time to meet their needs using participatory learning from simulation.
- We use the data user interface (UI) to look back at team trends over the past two years.
- We review the last two years of data to see what is in our team now.
- Backward looking data review is limited for guiding effective change.
- Even when we see trends that we like, we may not know what is causing those trends. And, we may be afraid that the next change we might make will undo it.
- It is also really demotivating to see trends we don’t like, and not know what is causing the problem.
- We will use the sim UI to look at team trends 2 years into the future to answer what if questions about different decisions the team could make. What we’re doing today is that looking back using the data UI.
- Simulation helps us to place a better initial bet about what is likely to pay off for our local Veteran community in terms of getting patients timely access to our highest quality care.
In-Session Exercise
Let’s get started!
![]() 00:15-00:20
00:15-00:20
Who would like to “drive” today? (Recommend the Team Lead)
1. Open an internet browser window. Go to mtl.how/data. First select your VISN and then select your facility.**
- This will take you to the VA’s corporate data warehouse site, the Business Intelligence Service Line (or BISL), where you will log in with your VA email and PIV passcode. This site contains Protected Health Information (PHI), so as a provider you will be granted access according to the permissions that are set up on your PIV.
- We’ll be opening the Modeling to Learn data user interface (UI) in Excel from here today.
- We’ll show you how files you pull from here will be saved back to the secure site, so that you can protect patient PHI just as you do in all your work.
- On the landing page, select your VISN. On the next page, select your team’s facility.
2. Explore the facility data.
- To view facility data click on the […] next to the file “facility.xlsb” and click “Edit” to open in Excel.
- Team files are in team folders. If you do not see a team folder, click on "Request New Team Folder in the horizontal header next the BISL logo.
- The facility data is designed to show trends relevant to your team vision of for the last two years. Let’s explore the information available in the facility data Excel spreadsheet:
There are two types of View options at the bottom of the spreadsheet. __________________ (Team Lead’s name) Will you please click through them, so we can see what each displays?
| View | Displays |
|---|---|
| Count (in Viz tabs) | Count tables that match the viz graphs |
| Data | Sortable report of de-identified individual patient data |
| Viz | Visualization of trends over time. |
There are four main data sets in the facility data:
(During intersession prep, facilitator should fill-in the rankings of the highest priority data categories that should be emphasized. Follow the team’s lead “live” during the meeting, but be prepared.)
| Rank | Data | Displays |
|---|---|---|
| ___ | Diag | Primary diagnosis only on visits in that setting level. (Note: In DataDiag, unique visits are shown, since each visit can only have one primary diagnosis. For more detail, open up the data UI.) |
| ___ | Enc | Encounter or visits types, such as medication management, psychotherapy, intakes etc. |
| ___ | HF | Health Factors data related to visits, including evidence-based psychotherapy templates, and other clinical reminders and screenings. |
| ___ | Meas | Standardized symptom scales, such as the PHQ-9 for depression or PCL-5 for PTSD, and suicide and behavioral risk flags. |
To sum up, there are three ways to view each set of data:
- Counts per month (within the associated Viz tab): vizDiag, vizEnc, vizHF, and vizMeas;
- Visual charts of trends over time: vizDiag, vizEnc, vizHF, and vizMeas
- Drill down patient-level data: dataDiag, dataHF, and dataMeas.
![]() 00:20-00:25
00:20-00:25
All data is sortable and filterable so that the team can transparently see how the charting you do all day becomes VA data.
Last meeting ________________________ (team members’ names) mentioned concerns with __________________________ (themes from session 1 team vision).
Time Stamp Team Learning Priorities Script for Session 2 What filtering options are available? Themes from the team vision to be highlighted. Team Data to Prioritize with the Team.  Keep an eye on time
For each “viz” chart, you can filter on location and clinic name (upper left) to zoom in to the clinic or VISTA clinic/“grid”.
(During intersession prep facilitator should fill-in the rankings of the highest priority viz that should be emphasized during the team meeting. Follow the team’s lead “live” during the meeting, but be prepared.).
| Rank | viz Options | |
|---|---|---|
| ___ | vizDiag | See trends in what types of diagnoses the facility/team is spending their time on (data are based on the primary diagnosis of each encounter, not the problem list for each patient.)* |
| ___ | vizEnc | See trends in what services the facility/team is spending their time providing.* |
| ___ | vizHF | See trends in what specifics the facility/team’s patients are getting in their encounters (in vis, this is a very long list.) |
| ___ | vizMeas | See trends in what standard measures the facility is using on their patients. Are they screening more for alcohol use disorder or depression or PTSD?* |
| ___ | dataDiag | can be sorted by primary diagnosis type based on ICD-10 code to see more detail on what happens in any one diagnosis type* |
| ___ | dataHF | can be sorted by health factor type to see more detail on what happens in any one health factor type.* |
| ___ | dataMeas | can be sorted by measurement type to see more detail on what happens in any one measurement type.* |
If the data is not loading or showing incorrect facilities/clinics, here’s how to refresh.
- To refresh your facility file’s data, right click on any tab at the bottom of the Excel spreadsheet and select “Unhide…”.
- In the “Unhide sheet:” dropdown, select “Control” and click “OK”.
- In the “Control” tab, select your VA facility’s station number in the “Station:” dropdown and click “Refresh”.
- Do not worry if you see your Excel worksheet become unresponsive as the data is refreshing and will take about 1-2 minutes to complete.
- As a warning, Do NOT click on “Propagate” as this is used by our data team to update facility data across the nation.
To create a fresh data UI file, go through Steps #3-5. We will show you the steps but you already have a fresh data UI file.
3. Scroll to your team folder at the bottom of the page. Open the data_ui folder and open your data_ui file in Excel.
- If you do not have a data_ui file or need a newly updated one, copy the file in the Master_DataUI folder. This has a master data_UI file that has already been pre-selected for your facility/station.
- Click on the 3 dots […] next to the data_ui file.
- Click on “Edit” to open in Excel, then click “Edit Workbook” at the top of the sheet.
4. Go to the ClinicSelection tab. Use columns C-H to select the clinics that make up your team.
- This data_ui file has already been specified for your facility/station.
- You can sort by Clinic Name, Division Name, Physical Location, Primary Stopcode, Secondary Stopcode, and Default Provider.
- Note that this will pull all clinics used in the last two years, including de-activated clinics (denoted by a “ZZ” prefix). You can also see the de-activated clinic’s inactivation date in column I.
- Follow the instructions in Box A2.
- After filtering, you can double-click on clinics to add them to column A, or you can highlight the clinics and click the gray “add all” button (Cell B6) to add them to column A.
- In the future, if you want to quickly get the same list of clinics again, you can select the grey “Get previous clinic list from last click of Get Patient-level Data” arrow in Column B (Cell B3).
5. To view your team patient data and your team trends click “Get Patient-level Data.” We will not do this in-session today.
You already have a fresh data UI file to work with in your data_ui folder. With your team lead (________), we selected the following clinics to represent your team.
To query patient and clinic level data using the data_ui, you will need LSV permissions. To check which facilities you have LSV access for, click the link to access the document through VA intranet.
If you don’t have access to facilities that you believe you should, please verify:
- CPRS access/permissions at your station (i.e COR tab access for CPRS).
- Your network username recorded in VistA. To have your network username recording in VistA, please follow the instructions outlined in the linked document through VA intranet.
It takes some time to stitch together a “hyper-local” query tailored to your team from the VA Corporate Data Warehouse.
On average (depending on the size of your team) it may take 15 minutes or so for your team data UI to pull in fresh data. And, Microsoft Excel will be unresponsive until the data UI has finished pulling in your data.
**Prior to today’s session, __________________ [Team Lead’s name] worked with us to build an initial team dataset.
__________________ [Team Lead’s name], which column did we find most helpful for creating this team’s dataset?
Are there any adjustments that the team would make to the clinic selection criteria? For example, should we include trainees? Other considerations that seem important?
We will look at the “Create Team Data Table” button and its associated tab “SPReferrals” next time.
6. Click to view the “viz” tabs, which show team trends.
Just like the facility data, there are team trends for diagnoses, encounters, health factor data (e.g., suicide plans, evidence-based practice templates), and measures from mental health assistant. Your team’s vision was about _______________. Let’s go to the _________________ viz tab to see data relevant to that issue.
You can further drill up/down in the “viz” tabs by right clicking on any trend line and clicking on “Quick Explore" (look for the magnifying glass). In the ”Explore“** box, pick the item you want to explore and click on "Drill To”. Keep using Quick Explore to drill until you reach the data you want. You can always click on the gray “Reset Pivot Chart”** button to return to the original settings.
The viz tabs will also always return to default selections every time the team clicks on “Get Patient-level Data” to refresh data in their data_ui file.
Note: If you use the “Quick Explore” drill down using patient names, all of the asterisked patients will be grouped together.
You can also right click on the line in a trend visualization and filter to hide a selected item or keep only the selected item.
vizDiag in the data UI shows a drill down by diagnoses or combination of diagnoses. For example, the “PTSD” line is for patients with only PTSD. The “PTSD & AUD” line is for patients with both these diagnoses but does not discriminate between which is the primary, secondary, etc. diagnoses.
dataDiag in the data UI has an additional column after “Diagnoses of Interest,” called “Primary Diagnoses”. “Diagnoses of Interest” retains all the current unordered diagnoses combinations, while “Primary Diagnoses” indicates what is the primary diagnosis. This means that if there is only one diagnosis in the “Diagnoses of Interest” column, it will still repeat what that diagnosis is in the “Primary Diagnoses” column.
00:25-00:35- What stands out to you about ________________________________(fill-in team vision)?
- What is most important to you to check out first related to ________________________________(fill-in team vision)?
(Prepare in advance, but ask this as an open-ended question)?
- What is most surprising? (Prepare in advance, but ask this as an open-ended question)?
00:35-00:40
7. Click to view the “data” tabs, which show your team’s individual patient information. - Patients who have requested restricted access to their information have asterisks (****) in Column F (dataDiag, dataHF) or Column E (dataMeas). If you are a VA provider, you can still identify patients from Column G (dataDiag, dataHF) or Column F (dataMeas).
Patient information corresponds to the same categories as the team trends: diagnoses, encounters, health factor data (e.g., suicide plans, evidence-based practice templates), and measures from mental health assistant.
Providers can filter to find specific patients, or produce reports.
![]() 00:40-00:50
00:40-00:50
(During intersession prep facilitator should fill-in the rankings of the highest priority viz that should be emphasized during the team meeting. Follow the team’s lead “live” during the meeting, but be prepared.)
| Time Stamp | Team Learning Priorities | Script |
|---|---|---|
| Prioritize which questions you will use given this team’s guiding vision. | ||
| Themes from the team vision to be highlighted. | Team Data related questions to Prioritize with the Team. | |
- What data tab would you use to find out how many current patients on the team are engaged in a specific evidence-based psychotherapy? What column shows you the session number (EBP template) that the patient is on.
- What viz tab would you use to see what the most common service encounters or visits are?
- Are there services that have been increasing over time?
- Are there services that have been decreasing over time?
- With the team trends (viz) and team patient (data) information in the data UI, your team can efficiently use team meetings to focus on the interrelated issues of care coordination and team quality improvement.
That’s it for Modeling to Learn how to check our patient data and team trends. Next is our Done/Do review.
Done and Do (15 minutes)
| We confirmed the clinics that make up our team for the Team Data UI. |
Review the HF, Diag, Enc and SP tabs in Team Data UI to find a patient (zoom in) and find a team trend (zoom out). Log in to mtl.how/data and look at the two team folders: data_ui and team_data_table. |
DO demo
- We encourage you to look around in your team data before next time.
- Go to mtl.how/data and open the team data in Excel.
- While waiting for the excel to open, let’s review the three reasons to use the excel-based Data UI instead of the facility data Excel spreadsheet.
- You can select a set of clinics (grids) that exactly represent your individual team.
- All the patient-level data are identified with patient names.
- You can create the team data table parameters used by the simulation user interface.
- Review your individual patient data and identify team trends.
- Health Factors (HF)
- Diagnoses (Diag)
- Encounters (Enc), and
- Measurement Based Stepped Care and Suicide Prevention (SP)
Until next time, thank you for Modeling to Learn!

5.2.4 Session 02 Say Checklist
Hello! I’m __________ and I’m __________. Today we’re modeling to learn how to check our patient data and team trends.
Navigate to the Learner See Guide for Session 2 to show Done and Do
Done and Do
| ![]() Done |
Done | ![]() Do |
| — | — |
|
Do |
| — | — |
| ![]() We identified our Team Vision of ___________; selected our Team Lead __________; and set a standing team meeting time at __________. We logged in to mtl.how/data to look at the Facility file.| We will select and review Team Data for MTL relevant to our Team Vision. |
We identified our Team Vision of ___________; selected our Team Lead __________; and set a standing team meeting time at __________. We logged in to mtl.how/data to look at the Facility file.| We will select and review Team Data for MTL relevant to our Team Vision. |
![]()
Learning Objectives for Session 2
- Describe the decisions your team made in producing your team data.
- Test out whether your expectations about team historical trends are displayed in the “viz” tabs.
- Apply your clinical expertise to identify new information about a team patient in the “data” tabs.
![]() Done by 00:10
Done by 00:10
Start in-session exercise. Note the goal is to become familiar with MTL data user interface (data UI) that looks back over 2 years of team data.
![]() 00:10-00:15
00:10-00:15
Participatory Learning from Simulation
- Graphic: how MTL can help us to get more of our Veterans to the right care in the right time to meet their needs using participatory learning from simulation.
-
We use the data user interface (UI) to:
- look back at team trends over the past two years.
- review the last two years of data to see what is in our team now.
- Backward looking data review is limited for guiding effective change.
- Reviewing trends: may like or not like the trends; may not know what is causing those trends; may be afraid that the next change we might make will undo it.
-
Review use of sim UI – to look at team trends 2 years into the future to answer what if questions about different decisions the team could make.
![]()
![]() 00:15-00:20
00:15-00:20
- Confirm who will “drive” today [Recommend the Team Lead]
1. On any browser, navigate to mtl.how/data.
-
Explain the Business Intelligence Service Line (or BISL) – VA’s corporate data warehouse site.
- You must have your PIV engaged to access the site.
- Reminder: BISL site contains Protected Health Information (PHI) - access is according to the permissions that are set up on your PIV.
- We’ll show you how files you pull from here will be saved back to the secure site, so that you can protect patient PHI just as you do in all your work.
- Select your VISN ______________.
-
On the next page, select your team’s facility ______________.
- To open the file, do not click directly on the file name.
- Instead, click on the 3 dots “…” next to the file, click “Edit”, and click “Open in Excel”.
- By having the file open on your desktop, you will have smoother and better experience with the Facility as it is a large file.
- Note: It may take some time to open and close the file since it contains 2 years worth of the facility’s data.
2. The Facility file is designed so see trends for the last two years relevant to your team vision of __________________________.
Let’s explore the information available in the BISL sharepoint Facility file:
- [ ] Have Team Lead review the three types of View options in the bottom tabs.
| View | Displays |
|---|---|
| Count (in the Viz tab) | Count tables that match the viz graphs |
| Data | Sortable report of de-identified individual patient data |
| Viz | Visualization of trends over time |
There are four main data sets in the Facility file: [Facilitator – review rankings of the highest priority data categories to emphasize for this team.]
| Rank | Data | Displays |
|---|---|---|
| ___ | Diag | Primary diagnoses only on visits in that setting level. (Note: In DataDiag, unique visits are shown, since each visit can only have on primary diagnosis. For more detail, open up the data UI). |
| ___ | Enc | Encounter or visits types, such as medication management, psychotherapy, intakes etc. |
| ___ | HF | Health Factors data related to visits, including evidence-based psychotherapy templates, and other clinical reminders and screenings. |
| ___ | Meas | Standardized symptom scales, such as the PHQ-9 for depression or PCL-5 for PTSD, and suicide and behavioral risk flags |
To sum up, there are three ways to view each set of data:
- Counts per month: countDiag, countEnc, countHF, and countMeas;
- Visual charts of trends over time: vizDiag, vizEnc, vizHF, and vizMeas
- Drill down patient-level data: dataDiag, dataHF, and dataMeas.
![]() 00:20-00:25
00:20-00:25
All data is sortable and filterable so that the team can transparently see how the charting you do all day becomes VA data.
1. Last meeting ________________________ [team members’ names] mentioned concerns with __________________________ [themes from session 1 team vision].
What filtering options are available?
2. For each “viz” chart, filter on location and clinic name (upper left) to zoom in to the clinic or VISTA clinic/“grid”.
During intersession prep facilitator should fill-in the rankings of the highest priority viz that should be emphasized during the team meeting. Follow the team’s lead “live” during the meeting, but be prepared.
| Rank | viz Options | |
|---|---|---|
| ___ | vizDiag | See trends in what types of diagnoses the facility/team is spending their time on (data are based on the primary diagnosis of each encounter, not the problem list for each patient).* |
| ___ | vizEnc | See trends in what services the facility/team is spending their time providing.* |
| ___ | vizHF | See trends in what specifics the facility/team’s patients are getting in their encounters (in vis, this is a very long list.) |
| ___ | vizMeas | See trends in what standard measures the facility is using on their patients. Are they screening more for alcohol use disorder or depression or PTSD?* |
| ___ | dataDiag | can be sorted by primary diagnosis type based on icd10 code, to see more detail on what happens in any one diagnosis type* |
| ___ | dataHF | can be sorted by health factor type, to see more detail on what happens in any one health factor type .* |
| ___ | dataMeas | can be sorted by measurement type, to see more detail on what happens in any one measurement type.* |
To create a fresh data UI file, go through Steps #3-5. We will show you the steps but you already have a fresh data UI file.
3. Your Team Data Folder - Scroll to your team folder at the bottom of the page. Open the data_ui folder and open your data_ui file in Excel.
4. Go to the ClinicSelection tab.
- Use columns C-H to select the clinics that make up your team.
-
Follow the instructions in Box A2.
- Double-click on clinics to add them to column A, or you can highlight the clinics and click the gray “add all” button (Box B6) to add them to column A.
5. To view your team patient data and your team trends click on “Get-Patient-level Data”.
You already have a fresh data UI file to work with in your data_ui folder. With your team lead (________), we selected the following clinics to represent your team.
- It takes some time to stitch together a “hyper-local” query tailored to your team from the VA Corporate Data Warehouse, may be up to 15 minutes.
- Prior to today’s session, __________________ [Team Lead’s name] worked with us to build an initial team dataset.
- Are there any adjustments that the team would make to the clinic selection criteria? For example, should we include trainees? Other considerations that seem important?
6. Click to view the “viz” tabs, which show team trends.
-
Let’s go to the [__ ] viz tab to see data relevant to that issue.
- “Quick Explore" (look for the magnifying glass). In the ”Explore“** box, pick the item you want to explore and click on "Drill To”. Keep using Quick Explore to drill until you reach the data you want. You can always click on the gray “Reset Pivot Chart”** button to return to the original settings.
![]() 00:25-00:35
00:25-00:35
What stands out to you about ________________________________[fill-in team vision]**?
What is most important to you to check out first related to ________________________________[fill-in team vision]? [Prepare in advance, but ask this as an open-ended quesiton]?
What is most surprising?
[Prepare in advance, but ask this as an open-ended quesiton]?
![]() 00:35-00:40
00:35-00:40
7. Click to view the “data” tabs, which show your team’s individual patient information.
-
Patients with restricted access to their information have asterisks (****) in Column F & G.
-
Patient information corresponds to the same categories as the team trends: diagnoses, encounters, health factor data (e.g., suicide plans, evidence-based practice templates), and measures from mental health assistant.
- Providers can filter to find specific patients, or produce reports.
![]() 00:40-00:50
00:40-00:50
| Time Stamp | Team Learning Priorities | Script |
|---|---|---|
| [Prioritize which questions you will use given this team’s guiding vision. | ||
| Themes from the team vision to be highlighted. | Team Data related questions to Prioritize with the Team. | |
| Keep an eye on time |
-
What data tab would you use to find out how many current patients on the team are engaged in a specific evidence-based psychotherapy? What column shows you the session number (EBP template) that the patient is on.
-
What viz tab would you use to see what the most common service encounters or visits are?
- Are there services that have been increasing over time?
- Are there services that have been decreasing over time?
That’s it for Modeling to Learn how to check our patient data and team trends. Next is our Done/Do review.
Done and Do (15 minutes)
| ![]() Done |
Done | ![]() Do |
| — | — |
| We selected the clinics that make up our team for the Team Data. | Review the HF, Diag, Enc and SP tabs in Team Data to find a patient (zoom in) and find a team trend (zoom out). Log in to mtl.how/data and look at the two team folders: data UI and team data. |
Do |
| — | — |
| We selected the clinics that make up our team for the Team Data. | Review the HF, Diag, Enc and SP tabs in Team Data to find a patient (zoom in) and find a team trend (zoom out). Log in to mtl.how/data and look at the two team folders: data UI and team data. |
5.2.5 Session 03 Say Guide
Today we’re modeling to learn how to produce team data for simulation.
Hello! I’m ________________ (facilitator’s name) and I’m _______________ (co-facilitator’s name). Today we’re modeling to learn how to produce team data for simulation.
As you see in the Done and Do table of the Learner See Guide at mtl.how:
Done and Do (15 minutes)
| We reviewed the HF, Diag, Enc and SP tabs in the Team Data UI to find a patient and a team trend. We logged in to mtl.how/data and looked at the two team folders: data_UI and team_data_table. |
We will produce our team_data_table for the MTL simulation user-interface (sim UI). |
After this session you will be able to:
![]()
Learning Objectives
Describe your team trends over the last two years based on the estimates in the team data table.
Test your understanding of how the team data are estimated by reviewing descriptions and definitions.
Apply your clinical expertise to consider the team trends in the data UI and team data table to identify team priorities for learning.
Let’s get started!
As the graphic illustrates, we use the data UI to look back at team trends over the past two years - what is; and we will use the sim UI to look at team trends 2 years into the future to answer what if questions about different decisions the team could make.
In-session Exercise (30 minutes): Team data table for simulation
Navigate to the data UI at mtl.how/data.
- You’ll log in with your VA credentials and you should have all the same permissions here as you do in general for your role in the VA.
- Scroll down to your team folder. You should have two folders: data_ui and team_data_table. Click on the “data_ui” folder and open the Excel file.
Clicking the “Create Team Data Table” button produces a table of descriptive team data.
You already have a fresh Team Data Table file to work with in the team_data_table folder.
It takes some time to generate a team data table for all modules using your team’s data.
On average (depending on the size of your team) it may take 15 minutes or so to generate a team data table. And, Microsoft Excel will be unresponsive until it is finished.
This is a different table from the one you generated last time by selecting the clinics that make up your team and then clicking “Get Patient Level Data.”
Data in this file are means, medians and percentages of key variables likely to influence the team’s priorities for learning from Modeling to Learn. Later on, we will upload this file to the sim UI so that it can read in these data, or parameters.
There are team data produced for each module of Modeling to Learn, each stored in its own tab:
- Care Coordination (CC) - tab title CCParams
- Medication Management (MM) - tab title MMParams
- Psychotherapy (PSY) - tab title PSYParams
- Aggregate mix of services (AGG) - tab title AggParams
- Measurement Based Stepped Care and Suicide Prevention (SP) - tab title SPParams
The patient cohort for each module is built by capturing all the unique patients who had a visit with the given team (from the user-supplied list of clinics/grids) within the correct encounter bin between 18 and 6 months ago. From that set of clinics, patients, and CPT codes, the data query then fetches all visits, no matter how long ago or how recent.
- In order to capture parameters that should be time-bound, such as new patients per week, the query can use that single year (e.g. from the patient cohort, how many were new to the team in the year that was used to build the cohort? Because that patient count captures all new patients over the year, we can just divide by 52 to get an average new patients per week).
- For parameters that should not be time-bound, all the visits can be considered, so that some patients will correctly be fed into the model with many visits over years of engagement.
We have already produced a team data table for you, but to do it yourself:
- Select a set of clinics in ClinicSelection tab similar to what you did last session. In the future, you can pull up the same clinics used last time for creating the team data table by clicking on the gray “Get previous clinic list from Create Team Data Table file” button (Cell B4) to add them column A.
- Additionally, if you want to produce team data for the SP module, click on the SPReferrals tab. Use this tab to select clinics that your team refers to/receives referrals from for the Suicide Prevention module. The data pull will track patients stepped up/down between your team and the one(s) you select. For example, if you are a GMH team, you would select “SMH” in the dropdown for “The clinics selected below that my team refers to are” and add the SMH clinics your team refers to in Column A. Once you have selected referral clinics in the SPReferrals tab, return to the “ClinicSelection” tab.
- Click on the module drop-down. You can choose any module individually (CC, MM, PSY, AGG, SP), all modules without SP, or all modules including SP. If you are choosing “SP” or “all with SP”, make sure to do the previous steps using the SPReferrals tab.
- Click on “Create Team Data Table”.
- If you included SP in the module selection, three pop-ups will appear for the three possible care settings (GMH, SMH, PC/PCMHI) to indicate the threshold for minimum gap in patient care required for subsequent visit to be considered a new care episode. In general for the (GMH or SMH or PC/PCMHI) setting, how long of a gap in patient care is required for the subsequent visit to be considered a new care episode? Set the threshold below in weeks. The default threshold is 39 weeks (9 months).
- The team_data_table file you generate will automatically be saved into the team_data_table folder. Regardless of the module selection you make, the team_data_table file will include all five module tabs and labels, but will populate zeroes (“0”) for all parameters of modules that were not selected.
Navigate back to your team folder at mtl.how/data. Click on the “team_data_table” folder and open the Excel file to find the team data table already produced for you.
1. Select a module for review
- To show what data are used to tailor each MTL module to your team.
[Choose a module]
- CCParams: Key variables of interest in CC may include median engagement in weeks, appointment supply in appointments per week, return visit interval in weeks, starting rate in patients per week, and new patient wait times.
- MMParams: Key variables of interest in MM may include median engagement in weeks, appointment supply in appointments per week, return visit interval in weeks, starting rate in patients per week, and slots allocation percent for providers with and without an X waiver.
- PSYParams: Key variables that can be explored in PSY include median engagement duration and engagement after the patient’s first 3 months measured in weeks, appointment supply by service type (AUD, DEP, OUD, PTSD) within 3 months, and return visit interval after 3 months in weeks.
- AggParams: Key variables in AGG include median engagement in weeks, appointment supply by service type, return visit interval in weeks, new patient start rate (mean), and service proportions from team data.
- SPParams: In SP, key variables of interest may include high risk flag rates, engagement times before ending treatment in a specific setting, engagement time before stepping down or up between care settings, wait times, and the ratio of high to low symptom patients in each setting.
Check out the different modules that are highlighted in the team data on the screen. As we review, we will use the mouse to highlight key team data variables.
- Find a variable that is important to your team. Look at how the variable is estimated in the table. Notice the units.
- Where can you find even more detailed information about your team data? In each of these Params tabs, you can find more detailed information about your team data.
- Check out the two columns to the right of the numerical data [show with mouse]. Let’s explore these two columns. This column [highlight column] gives the description or definition of the variable. This column [highlight column] contains additional details about how individual patient data are extracted and used to calculate your team’s historical trends.
2. Select a second module for review
- Check out the last 2 columns, to the right of the numerical data. This column [highlight column] gives the description or definition of the variable. This column [highlight column] contains additional details about how individual patient data are extracted and used to calculate your team’s historical trends.
- Find a variable that is important to your team. How is it estimated in this table? What are its units?
- Where can you find even more detailed information about your team data?
- You can click on the “DataNotes” tab for a breakdown of how the patient cohort is defined, which CPT codes are used to define each service, and the patient engagement patterns (for the Psychotherapy module).
3. Are there any team data table values you would like to explore in the team data UI?
- If so, which ones? Open the data UI to examine your question.
4. Does the team see any values in the team data that seem to vary significantly from expectations?
If so, what is it surprising?
Does the estimation definition (second to last column, text in red) help you to interpret the variable value?
5. Does the team see any values in the team data that fit your expectations about high priority team needs?
If so, what are you noticing?
In what ways does the team data fit with your day-to-day clinical practice in your team?
That’s it for Modeling to Learn how to produce team data for simulation. Next is our Done/Do review.
Done and Do (15 minutes)
| We produced team data table for the MTL simulation user-interface (sim UI). |
 Find something in the team data table and complete the mtl.how/menu (behind VA firewall) to prioritize your needs. Responses are confidential. Find something in the team data table and complete the mtl.how/menu (behind VA firewall) to prioritize your needs. Responses are confidential. |
DO demo
- We encourage you to look around in the team data table before next time. Test whether you can find a piece of data you decide to look for. Just take a minute, if you can, to become familiar with the format and content of the data table. Remember, you can click through the Params tabs, one for each module, to dig into the details of how each parameter is calculated in the text columns to the right of the numerical data.
- The next thing we ask is that each member of the team fill out a short form that you’ll find at mtl.how/menu. It will take about 12 minutes. Your responses will be confidential; no identifying information is collected.
- We will aggregate the responses and consider them together in the next session to help the team choose which MTL module we’ll use for the next several sessions of Modeling to Learn.
Until next time, thank you for Modeling to Learn!
5.2.6 Session 03 Say Checklist
Today we’re modeling to learn how to produce team data for simulation.
- Hello! I’m __________ and I’m __________ [Co-facilitators introduce themselves]. Today we’re modeling to learn how to produce team data for simulation.
Navigate to the SEE guide to show Done/Do table
![]() ____________ Time 00:00-00:10 - Done/Do and Learning Objectives
____________ Time 00:00-00:10 - Done/Do and Learning Objectives
-
 Done: We reviewed the HF, Diag, Enc and SP tabs in your team data to find a patient and a team trend. We opened mtl.how/data in a browser and looked at the two team folders: data UI and team data table.
-
 Do: We will produce a team data table for the MTL simulation user-interface (sim UI).
Learning Objectives for Session 3
- Describe your team trends over the last two years based on the estimates in the team data table.
- Test out your understanding of how the team data is estimated through review of the descriptions and definitions.
- Apply your clinical expertise to consider the team trends in the data UI and team data table to identify team priorities for learning.
Start In-session Exercise
![]() ____________ Time 00:10-00:15 – Review Graphic & Navigate to mtl.how/data
- [ ] We will use the data UI to look back at team trends over the past two years - what is;
____________ Time 00:10-00:15 – Review Graphic & Navigate to mtl.how/data
- [ ] We will use the data UI to look back at team trends over the past two years - what is;
- [ ] We will use the sim UI to look at team trends 2 years into the future to answer what if questions about different decisions the team could make.
1. Navigate to the data UI at mtl.how/data.
- Data UI on VA’s secure SharePoint site; works on any browser.
- You must have your PIV card engaged and you should have all the same permissions to access the site.
- Scroll down to see your team folders: data_ui and team_data_table. Click on the “data_ui” folder and open the Excel file.
![]() ____________ Time 00:15-00:25 – Review how to “Get Team Data Table”
____________ Time 00:15-00:25 – Review how to “Get Team Data Table”
2. Clicking the “Get Team Data Table for Sim UI” button produces a table of descriptive team data. IMPORTANT: You already have a fresh Team Data Table for Sim UI file to work with in your team_data_table folder.
- Takes time to generate a team data table for all modules using your team’s data; depending team size
- Data in this file are means, medians and percentages of key variables likely to influence the team’s priorities for learning from Modeling to Learn.
-
There are team data produced for each module of Modeling to Learn, each stored in its own tab:
- Care Coordination (CC) - tab title CCParams
- Medication Management (MM) - tab title MMParams
- Psychotherapy (PSY) - tab title PSYParams
- Aggregate team services (AGG) - tab title AggParams
- Measurement-based stepped care and suicide prevention (SP) - tab title SPParams
- [ ] Team data table is already generated for you, but to do it for yourself:
– [ ] Select a set of clinics in ClinicSelection tab.
– [ ] Click on “create Team Data Table”
See SAY guide for narration details on generating file for SP module
- The file you generate will have all five module tabs and labels, but will produce “zeroes/0” as values for parameters of the modules that were not selected.
- Navigate back to your team folder at mtl.how/data. Click on the “team_data_table” folder and open the Excel file to find the team data table already produced for you.
![]() ____________ Time 00:25-00:35 – Select and review a MTL Module
____________ Time 00:25-00:35 – Select and review a MTL Module
3. Let’s select a module for review - to show what data are used to tailor each MTL module to your team.
[Choose a module] – See SAY guide for descriptions of each module
-
Check out the different modules that are highlighted in the team data on the screen. As we review, we will use the mouse to highlight key team data variables.
-
Find a variable important to your team. Look at how it is estimated in the table and notice the units.
-
Params tabs have more detailed information about team data.
-
Review the two columns to the right of the numerical data [show with mouse]:
– This column [highlight column] gives the description or definition of the variable.
– This column [highlight column] contains additional details about how individual patient data are extracted and used to calculate your team’s historical trends.
![]() ____________ Time 00:35-00:45 – Select and review a second MTL Module
____________ Time 00:35-00:45 – Select and review a second MTL Module
4. Let’s select a second module for review.
-
Again, check out the last 2 columns, to the right of the numerical data.
-
Find a variable important to the team. How is it estimated in this table? What are its units?
- Where can you find even more detailed information about your team data? Click on the “DataNotes” tab for a breakdown of how the patient cohort is defined, CPT codes used, and patient engagement patterns (PSY module).
![]() ____________ Time 00:45-00:50 – Explore team data table values of interest to the team
____________ Time 00:45-00:50 – Explore team data table values of interest to the team
5. Are there any team data table values you would like to explore in the team data UI? 6. Do you see any team data values that differ a lot from what you would expect? 7. Do you see any team data values that confirm your thoughts about high priority team needs?
- What are you noticing? What is surprising?
- In what ways does the team data fit with your day-to-day experience?
That’s it for Modeling to learn how to produce team data for simulation. Next is our Done/Do review.
Navigate to the SEE guide to show Done/Do table
![]() ____________ Time 00:50-01:00 – Done / Do Review
____________ Time 00:50-01:00 – Done / Do Review
-
Done: We produced team data for the MTL simulation user-interface (sim UI).
-
Do: Find something in the team data table. Complete the mtl.how/menu to prioritize your needs. Responses are confidential.
DO demo
- Encourage team members to look around in the team data table before next time.
- Ask team members to fill out form at mtl.how/menu (open on Chrome or Edge for the best experience).
- The username is yout VA email. It will take about 5 minutes.
- Responses will be aggregated and discussed in Session 4 to help choose which MTL module we’ll use for the next several sessions of Modeling to Learn.
Until next time, thank you for Modeling to Learn!
5.2.7 Session 04 Say Guide

MTL Live Session 04
Today we’re modeling to learn how to prioritize team needs.
Hello! I’m ________________ (facilitator’s name) and I’m _______________ (co-facilitator’s name). Today we’re modeling to learn how to prioritize team needs.
As we see in the Done/Do table of the Learner See Guide:
Done and Do (15 minutes)
| We found something in the team data table and completed the mtl.how/menu to prioritize our needs. |
We will review the MTL Menu results to prioritize our team needs and select an MTL module. |
After this session you will be able to:
![]()
Learning Objectives
Describe the high priority needs reported across the team.
Test out how these needs are experienced across the team through team dialogue.
Consider the team vision and apply team decision-making to select a high-priority module of MTL.
Let’s get started:
In-session Exercise (30 minutes)
- Menu results and team needs discussion.
1. Complete the MTL Menu on your own.
- If you have not completed the MTL Menu at mtl.how/menu, please take 5 minutes to complete it. Your username is your VA email.
- Once everyone on the team has completed the MTL Menu, and we will show the tabulated results [Show Menu Results].
- You will receive a summary of this in your follow-up email.
2. Review the team’s results with your team.
- What stands out to you?
- First we’ll scan through the results and see what stands out. [Lead discussion; take notes.]
3. Look for areas of consensus among the team.
- What does the team agree about?
- Where are there areas of high consensus? What issues does the team agree about?
Decide which Menu results to show to reinforce consensus, based on relevance to the team’s priority needs and ability to assist us with our differential. Should be related to charts shown in Session 3.
4. Discuss items in which team members varied a lot in their rankings.
- Where does the team have more variable perspectives?
- What are the topics where team members’ perspectives are more divergent?
Decide which Menu results to show to discuss divergence, based on relevance to the team’s priority needs and ability to assist us with our differential. Should be related to charts shown in Session 3.
5. Focus on the high priority needs to select a module for sessions 5-10 of Modeling to Learn.
- What is the highest priority need for your team now?
- Let’s think about which Modeling to Learn module best addresses that need. [Recap the highest priority need, recommended module, and why.]
There are currently 5 MTL modules available for teams to focus on in sessions 5 through 10:
- Care Coordination (CC)
- Medication Management (MM)
- Psychotherapy (PSY)
- Aggregate mix of services (AGG)
- Measurement-based stepped care and suicide prevention (SP)
What the models do:
- CC shows how a variety of team decisions interact to impact multiple outcomes at the same time. You can explore trade-offs between decisions such as desired new patient wait times, current patient return visit intervals, and overbooking, and how they affect team outcomes like total missed appointments, number of patients in care, and number of patients completing care.
- MM enables you to experiment with how team decisions about referrals, time allocation, and visit frequency impact the quality of medication management for patients. Your team can explore scenarios to balance these tradeoffs and better meet the specific needs of patients with depression, alcohol use disorder and opioid use disorder. Insights you gain can help you increase local reach of evidence-based pharmacotherapies.
- PSY shows how team psychotherapy decisions interact, and depicts patterns of psychotherapy engagement in your team. You can explore solutions to the challenges of getting patients to complete a full course of therapy, while also achieving goals to start enough new patients in psychotherapy. Insights about these dynamics can be used to increase the local reach of evidence-based psychotherapies.
- AGG shows how a variety of team decisions interact to affect your overall mix of services. You can explore trade-offs between decisions such as desired new patient wait times, current patient return visit intervals, and overbooking, and how they affect team outcomes like total missed appointments, number of patients in care, and number of patients completing care. You can compare the effects of different decisions on outcomes in one service, or you can compare the effects of one decision on different services.
- SP shows the effects of measurement based stepped care on patients’ symptoms and risk. It allows you to explore the impacts of implementing measurement based care to reduce delays in detecting patients at high risk for suicide, and to improve the quality of care by making better team decisions about when to step patients up to a higher level of care, or step them down to a lower level of care. It is also possible to experiment with team decisions related to new patient wait-times and access, the use of community care, and the impacts of provider overwork and burnout on the quality of care.
That’s it for Modeling to learn how to prioritize team needs. Next is our Done/Do review.
Done and Do (15 minutes)
| We prioritized team needs and selected an MTL Module: care coordination (CC), medication management (MM), psychotherapy (PSY), suicide prevention (SP) or aggregate (AGG). |
Log in to the MTL simulation user interface (sim UI) at mtl.how/sim. |
DO demo
- For the next 5 sessions, we will use the Modeling to Learn Simulation User Interface, or sim UI.
- Remember, all the MTL resources can be accessed from your home base at mtl.how if you forget a specific link. But to go directly to the log-in page for the sim UI, just type mtl.how/sim into your browser.
- The sim UI does not work on the Internet Explorer, please use any of the other available browsers such as Edge, Chrome, FireFox, or Safari via desktop or mobile.
- The sim UI is designed for use with a variety of devices, from large-monitor desktops to tablets and smartphones. The view adjusts for different sizes and aspect ratios so you may notice some slight variations in how it looks, but the basic functionality is the same on all of them.
- To log in to the sim UI, you will need your username and password. Once you enter your credentials, you’ll be asked to select a World, and you’ll see 2 options in the drop-down menu: a team world and an individual world. We’ll describe these more next time. For now you should choose the one that ends with “ind” for individual. Click Log In, and check out the MTL sim UI landing page.
- You won’t be able to go further than that yet, but feel free to look around at what’s on that page.
Until next time, thank you for Modeling to Learn!
5.2.8 Session 04 Say Checklist
Today we’re modeling to learn how to prioritize team needs.
Hello! I’m __________ and I’m __________ , and today we’re modeling to learn how to prioritize team needs.
Navigate to the SEE guide to show Done/Do table
![]() ____________ Time 00:00-00:10 – Done/Do and Learning Objectives
____________ Time 00:00-00:10 – Done/Do and Learning Objectives
-
Done: We found something in the team data table and completed the mtl.how/menu to prioritize our needs.
-
Do: We will review the MTL Menu results to prioritize our team needs and select an MTL module.
-

Learning Objectives for Session 4
- Describe the high priority needs reported across the team.
- Test out how these needs are experienced across the team through team dialogue.
- Consider the team vision and apply team decision-making to select a high-priority module of MTL.
Start In-session Exercise (30 minutes)
![]() ____________ Time 00:10-00:25 – Complete MTL Menu
____________ Time 00:10-00:25 – Complete MTL Menu
1. Complete the MTL Menu.
-
If you have not already done so, navigate to mtl.how/menu and complete the form. It will take about 5 minutes.
- Please use Chrome or Edge for the best experience.
- Your username is your VA email.
-
Once everyone on the team has completed the MTL Menu, we will show the tabulated results shown on screen. [Facilitator shows Menu results]
- A summary of the results will be included the follow-up email to this session.
![]() ____________ Time 00:25-00:40 – Review MTL Menu Results
____________ Time 00:25-00:40 – Review MTL Menu Results
2. Review the team’s results with your team.
- What stands out to you? [Lead discussion; take notes.]
3. Look for areas of consensus among the team.
-
What does the team agree about? Where are there areas of high consensus?
-
Decide which Menu results reinforce consensus, based on relevance to the team’s priority needs and ability to assist us with our differential.
- Should be related to charts shown in Session 3
4. Discuss items in which team members varied a lot in their rankings.
-
Decide which Menu results to show to discuss divergence.
- Should be related to charts shown in Session 3.
- Should be related to charts shown in Session 3.
- Where does the team have more variable or divergent perspectives?
![]() ____________ Time 00:40-00:50 – Identify team priority and MTL Module
____________ Time 00:40-00:50 – Identify team priority and MTL Module
5. Focus on the high priority needs to select a module for sessions 5-10 of Modeling to Learn
- What is the highest priority need for your team now?
-
Discuss which Modeling to Learn module best addresses the team need. [Recap the highest priority need, recommended module, and why.]
-
Give overview of 5 MTL modules available for teams to focus on in sessions 5 through 10:
- Care Coordination (CC)
- Medication Management (MM)
- Psychotherapy (PSY)
- Aggregate mix of services (AGG)
- Measurement-based stepped care and suicide prevention (SP)
- Care Coordination (CC)
Navigate to the SEE guide to show Done/Do table
![]() ____________ Time 00:50-01:00 – Done/Do
____________ Time 00:50-01:00 – Done/Do
That’s it for Modeling to learn how to prioritize team needs. Let’s review the Done/Do.
-
Done: We prioritized team needs and selected an MTL Module: care coordination (CC), medication management (MM), psychotherapy (PSY), suicide prevention (SP) or aggregate (AGG).
-
Do: Log in to the MTL simulation user interface (sim UI) at mtl.how/sim.
DO demo
- Note use of the Modeling to Learn Simulation User Interface, or sim UI, for sessions 5 to 10.
-
All MTL resources can be accessed from your home base at mtl.how
- The sim UI does not work on the Internet Explorer, please use any of the other available browsers such as Edge, Chrome, FireFox, or Safari via desktop or mobile.
-
The sim UI is designed for use with a variety of devices. The view adjusts for different sizes and aspect ratios so you may notice some slight variations in how it looks, but the basic functionality is the same on all of them.
- To log in to the sim UI, you will need your username which is your VA email and the password which we will send in the follow-up email.
- Once you enter your credentials, you’ll be asked to select a World, and you’ll see 2 options in the drop-down menu: a team world and an individual world. We’ll describe these more next time. For now you should choose the one that ends with “ind” for individual.
- Click Log In, and check out the MTL sim UI landing page.
Until next time, thank you for Modeling to Learn!
5.2.9 Session 05 Say Guide

MTL Live Session 05
Today we’re modeling to learn how to log in to our team world.
Hello! I’m ________________ (facilitator’s name) and I’m _______________ (co-facilitator’s name). Today we’re modeling to learn how to log in to our team world.
Done and Do
| We checked to make sure we could log in to the sim UI at mtl.how/sim. |
We will upload our team data to the sim UI and review our data in the Experiments section. |
After this session you will be able to: \[ [<img src = "https://github.com/lzim/teampsd/blob/master/resources/icons/timestamp.png" height = "15" width = "15">](#DontClick) \]
![]()
Learning Objectives
- Describe the team data in the Experiments section.
- Test out the simulation user-interface for more information about team data.
- Apply clinical expertise to consider the decisions the team makes that affect these variables.
Participatory Learning from Simulation \[ [<img src = "https://github.com/lzim/teampsd/blob/master/resources/icons/timestamp.png" height = "15" width = "15">](#DontClick) \]
- In Sessions 2 and 3 we used the data UI to look back at team trends over the past two years. That gave us a sense of what IS in our team now. For example, we saw that ___________________
- Backward looking data review is limited for guiding effective change. Even when we see a trend we like, we may not know what is causing it, and we may worry that the next change we make will undo it. It can also be demotivating to see trends we don’t like and not know what’s causing the problem.
- Today we’re at a turning point where we will begin to use the simulation UI to anticipate future trends. We’ll start asking what if questions about different decisions the team could make.
- With the sim UI we have a way to test our hypotheses about those questions that lets us learn “as quick as we learn not to touch a hot stove”. And even more importantly, this virtual world lets us test our “what if” questions without any risk to the well-being of veterans.
- Simulation helps us to place a better initial bet about what is likely to pay off for our local Veteran community in terms of getting patients timely access to our highest quality care.
In-session Exercise \[ [<img src = "https://github.com/lzim/teampsd/blob/master/resources/icons/timestamp.png" height = "15" width = "15">](#DontClick) \]
The Team Lead, or whoever is willing to drive today: open a Chrome browser, then screen-share both applications in Microsoft Teams.
1. In session 3, we used our team data UI and clicked “Create Team Data Table” to produce our team data for simulation. \[ [<img src = "https://github.com/lzim/teampsd/blob/master/resources/icons/timestamp.png" height = "15" width = "15">](#DontClick) \]
2. Let’s now go back to mtl.how/data in the browser window to check the name of our team_data_table file.
- We want to grab the filename from there so we can upload it to the sim UI. Open a browser window and go to mtl.how/data.
3. The team data file for simulation is in our team folder, in the team_data_table folder. \[ [<img src = "https://github.com/lzim/teampsd/blob/master/resources/icons/timestamp.png" height = "15" width = "15">](#DontClick) \]
- Navigate to the team_data_table folder and click the “dot-dot-dot” so you can copy the filename of your team_data_table.
4. Log in to the sim UI. \[ [<img src = "https://github.com/lzim/teampsd/blob/master/resources/icons/timestamp.png" height = "15" width = "15">](#DontClick) \]
- Open a new browser window in Google Chrome and go to mtl.how/sim. The Modeling to Learn simulation user interface does not work on Explorer. Please use Edge, Firefox, Chrome or Safari via desktop or mobile.
- Enter your login credentials - username is your VA email address and password should have been provided to your team in the Session 5 Pre email. Use all lowercase. If you forget your password, click on the red “Reset Password” at the bottom of the login section. An email will be sent to you to create a new password.
- Click the down-arrow in the Please select a World pop-up. You see two options - one has “team” in it and the other has “ind” for “individual” in it. Since we’re working together now as a team, choose the team world. Any time the team is collaborating together at the same time, this is the world to choose. If you are exploring the sim UI on your own, it’s best to select your individual world so you don’t inadvertently change anything in the team’s world. You are welcome to log in to your individual world any time and play around. There is nothing you can break there!
- An important thing to note is that this application has a responsive web design, so it adjusts the page layout to optimize to your screen’s dimensions. For example, if you use your browser control to reduce the window size, the sim UI will stack these sections vertically instead of showing them side by side. It will probably look like that if you are logged in on a smartphone. So just keep in mind that the sim UI may look different on different devices, but all the same functionality is still there.
- If there is a critical issue that everyone needs to be alerted to, there will be a red “Alert” pop-up upon login, alerting everyone to the issue. These issues are our top priority to resolve due to their level of criticality. Once you dismiss this alert once, it will not reappear. Note, this alert will appear in both your team and individual worlds, so you will need to dismiss it twice.
Upon clicking buttons like the “Play” or “Run” icon, a quick tip will appear on the loading screen on different functions in the sim UI.
5. Orient yourself to the home page (Team name, navigation icons, player name, welcome text, sections with blue headers). \[ [<img src = "https://github.com/lzim/teampsd/blob/master/resources/icons/timestamp.png" height = "15" width = "15">](#DontClick) \]
- At the top left is the MTL logo. That’s on each page, and it works as a Home button (just like the button next to it).
- Scanning across that row you see your Team name followed by six navigation icons: Home, Play, Team, More Info, News, Report Bug, Tutor, and Logoff. These are pretty self-explanatory, but I would highlight the Logoff button. It’s best to log off when you’re finished with a session. At the far right along the top is your name and picture (if you’ve uploaded by clicking on the “Avatar” function).
- Click on the “Team” icon to chat with your team or facilitator.
- Click on the “More Info” icon for more info on the sim UI.
- Click on the “News” icon for news flashes on discussion items. Your input on discussion items in the Community of Practice is appreciated. A red pop-up with a number will appear next to this icon (similar to how text messages work on your phone) to alert you to the number of un-read news flashes. Once you read the news flashes, the red pop-up will disappear, but you can always click on “News” to review the current new flashes.
- Click on the “Report Bug” Icon in the top nav bar to report issues.
- Never include any PII/PHI in your description and screenshot.
- To include screenshots, you can:
- Copy & paste from Snipping Tool
- Drag & drop a screenshot file
- Upload your screenshot file
- Copy & paste from Snipping Tool
- Click on the “Tutor” icons for an “over the shoulder” orientation to the different icons, blue headers, and functions of each page. Each red tutor pop-up includes icons for:
- Video: Links to the relevant TMS video for this section.
- Guide: Links to the relevant session guide for this section.
- Back/Next: Move back or next in the tutor instructions for this section.
- Close: Close the tutor pop-up. Click on any tutor icon at any time, to get “over the shoulder” instructions for this section.
- Video: Links to the relevant TMS video for this section.
- Click on the “Community” button on the bottom right if:
- You have an idea
- You like something
- You have a question:
- See if someone already answered your question online in the Community of Practice.
- Set up a GitHub account to ask your question directly in the Community of Practice.
- Email your question to mtl.help@va.gov
- See if someone already answered your question online in the Community of Practice.
- You have an idea
- Never include any PII/PHI in your description and screenshot unless you are emailing mtl.help@va.gov from your VA email. The Community of Practice is a public platform. Follow established VA guidance on posting information to the public.
- To include screenshots in the “Community” button, you can:
- Copy & paste from Snipping Tool
- Drag & drop a screenshot file
- Upload your screenshot file
- Copy & paste from Snipping Tool
- Click on the “Team” icon to chat with your team or facilitator.
- Below that row is the MTL welcome text, and under that there are 3 section headings in blue bars: Session; Experiment Maintenance; and Team Data Dropdown Maintenance. Whenever you see blue bars like these with a white triangle on the right, that means those sections can be expanded and collapsed by clicking on the bar.
- If you’re not designated as a Team Lead, you won’t see all of these features. But everyone is the “Team Lead” for their individual world, so will see all of these sections when you’re logged in there.
- We’ll be using the other two sections in a minute, but for now let’s expand the middle section and take a look. This is where you can manage the experiments you’ve run - you can delete, rename, or export them from here. Right now it’s empty, but it won’t be for long!
6. Start a New Session. \[ [<img src = "https://github.com/lzim/teampsd/blob/master/resources/icons/timestamp.png" height = "15" width = "15">](#DontClick) \]
- Start a New Session and review the sim UI Main Page.
- Select the module your team decided to use.
- Select the team data you just uploaded.
- Click Play. (For the Care Coordination and Medication Management (CC & MM) modules, after you click Play, you need to select your Learning Mode.)
- If you are using a Learning Mode, refer to the Care Coordination (CCParams) or Medication Management (MMParams) tab of the Team Data Table at mtl.how/data, for data regarding the team’s New Patient Start Rates and Return-to-Clinic Intervals.
- Note: Once you pick a Learning Mode to prioritize the New Patient Start Rate or the Existing Patients Return-to-Clinic Visit Interval, this will be the setting your team will experiment with through Session 12 for the rest of the Modeling to Learn program.
- Existing Patient Return-to-Clinic Visit Interval: Choose this learning mode to prioritize the Existing Patients Return-to-Clinic Visit Interval (RVI) estimated from team data, and only start new patients in remaining open slots after the existing patient RVI, appointment supply, and missed appointments are all taken into account.
- New Patient Start Rate: Choose this learning mode to prioritize the New Patient Start Rate estimated from team data, and only see existing patients in remaining open slots after the new patient start rate, appointment supply, and missed appointments are all taken into account.
- If you are using a Learning Mode, refer to the Care Coordination (CCParams) or Medication Management (MMParams) tab of the Team Data Table at mtl.how/data, for data regarding the team’s New Patient Start Rates and Return-to-Clinic Intervals.
- Upon clicking icons like “Play,” “Run,” or "Reset,’ a quick tip will appear on the loading screen on different functions in the sim UI.
7. Orient yourself to the Main Page of the Sim UI (Notice the same information and buttons at top; 4 sections with blue header - one showing the module and team data selected in its header; the others headed Outputs and Text, Experiments, and Text).
- You see the same information and buttons across the top as the Home page.
- There’s a new set of sections with blue headers below that. Let’s click inside the large blue header on the left to minimize that section, because we aren’t going to need it today. But notice inside that bar it tells you which module and team data file we selected.
- To the right of the main section are 3 blue bars labeled Outputs and Text, Experiments, and Text. You can drag the Text section around by the blue bar. You can also expand, minimize, or close it with the icons on the top right side of the blue bar. Expand it to open up the Outputs section, including the Text boxes. Reduce it back to Text-only the same way you expanded it. If you close it with the X, you can get it back by going to the Outputs and Text section and selecting Expand.
- You can use the app’s responsive design feature to enlarge the view. Use the magnifier (+/-) or the shortcut Control/Shift/+ (or minus) to make things bigger or smaller. At some point, the design layout changes to stacked sections instead of having them side by side. This is the way it will look on a smartphone screen, or sometimes with other types of monitors.
- Record the team’s high-level learning Question.
- Open and expand the Outputs and Text section if you need to.
- Type your question about _________________________________ into the Question box.
- Click Save. We will discuss naming more next time. For now, just click the down arrow at the first prompt and choose “bc” (stands for base case), and Add, then click the Save button at the top. (We do not want to “save and reset”.) Click Yes at the prompt.
- Check out the Team Data Table.
- “Exclamation points” in the Team Data Table for Measurement Based Stepped Care & Suicide Prevention (SP): Sometimes we may have estimates derived from very few observations. We decided to set infrequently observed values to zero to avoid inflation of rarer episodes of care. Poor inferences are possible using estimates when the count is low and the duration is low. If the values are <1% of the total counts of episodes of care in the team, and they are retained in the model, it will inflate rare episodes.
- Exclamation points in the Team Data Table will indicate when a parameter is too low to be validly used.
- The relevant red parameter values in the model diagram will have a corresponding exclamation point.
- You will get a pop-up message from clicking on the exclamation point in either the Team Data Table or the Model Diagram to explain what is happening.
- Our goal is to make the learners aware when low counts are used for estimates. A key systems insight for facilitators is that teams will always find the highest leverage change focusing on where the patients are (i.e., stocks or flows).
- Here is an example competing for the same outflow of patients from PC/PCMHI:
- PC/PCMHI to GMH: Episode count is 31 and duration is 30 weeks. This is most common step-up path.
- PC/PCMHI to SMH: Episode count is 1 and duration is 14 weeks. This step-up engagement pattern was only observed once.
- Because the flow is based on the engagement duration (weeks), this is an example of 30:1 difference in episode counts, but the difference in engagement duration is actually only 2:1 (30 weeks to 14 weeks). Retaining this parameter to estimate these model outflow (pts/wk) over the course of a two year experiment timeline would exaggerate the number of patients who step up from PC/PCMHI to SMH from 1 to 20 and reduce the number who step up from PC/PCMHI to GMH from 30 to 10.
- If we set it to zero it won’t include this rare flow in the basecase. Because the outflow that is infrequently observed is set to zero, it will slightly inflate the other stock outflows, but this is better than extreme exaggeration of an uncommon episodes of care.
- However, the Measurement Based Stepped Care for Suicide Prevention module includes low base rate patterns for high risk flag patients. The outflows from the HRF Patients stock are to residential. Sim UI - Setting View:
- *PC/PCMHI - Residential, GMH or Unflag (3 outflows)
- *GMH - Residential or Unflag (2 outflows) - likely to keep their HRF flag patients
- SMH - Residential, GMH or Unflag (3 outflows) - no change
- Inpatient was not included as an outflow from any setting view because the patient never really transfer fully to the inpatient setting, they are still typically managed by the team coordinating their treatment before the inpatient stay and after discharge from an inpatient stay. The episode counts for HRF patients are always likely to represent a low percentage of the total episodes of care in the team.
- Here is an example competing for the same outflow of patients from PC/PCMHI:
8. Expand the Experiments section and read the “i” information for the Team Data Table.
- Open the section by clicking on the white down arrow in the right corner of the blue bar.
- The data in this table come straight from the file we just uploaded. In fact, throughout the sim UI, we’ve used the convention that red font means “read in from team data”.
- Click on the “i” in the red circle next to Team Data and read the “i” information. Throughout the Sim UI, we use “i” symbols for information pop-ups. Here, the “i” information is telling you how the data that you record, that you reviewed and chose in the data UI, are used to calculate or estimate the values in this Team Data Table.
- What types of decisions does the team make that affect these variables?
- Close the “i” information and look over the values - how do they strike you? Do they line up with how you think things are in your team? In particular, notice __________________________________________
9. Find the Team Data Table variables in the system diagram at the left.
- True Missed Appointments %
- Appointment Supply
- Return Visit Interval
- Engagement Duration
- New Patient Start Rate (AGG)
5.2.10 10. Log out of the Sim UI.
That’s it for Modeling to Learn how to log in to our team world!
Done and Do (15 minutes)
| We logged in and uploaded our team data table to the sim UI, and reviewed our team data in the Experiments section. |
Check the “i” information available in the sim UI Model Diagram and Experiments section. |
DO demo
- For next time, if you can, log in to to the sim UI at mtl.how/sim.
- Remember that when you first enter your log-in credentials, you’ll be able to choose between your Team world and your Individual world. If you choose your Team world, it will already have a “session” started - because we did that today when we chose the module and selected the team data file that we had added. So you will choose Join Current Session and click Play.
- If you’re ambitious to dig in and “play” in the sim, you can choose your Individual world and add the team data to the team data menu the same way we did just now. Then you can choose the module, select the data, and click Play. You can explore to your heart’s content in your Individual world without worrying that you’ll “break” anything or change anything for the rest of your team.
- Whichever way you get to hitting Play from the Sim UI landing page, it will take you to the main page for the module. We encourage you to explore the interface more.
- In particular, check out the “i” information available throughout the sim UI - in the Experiments section and in the model diagram - to prepare for our next session.
Until next time, thank you for Modeling to Learn!
5.2.11 Session 05 Say Checklist
Today we’re modeling to learn how to log in to our team world.
Navigate to the SEE guide to show Done/Do table
![]() ____________ Time 00:00-00:10 – Done/Do and Learning Objectives
____________ Time 00:00-00:10 – Done/Do and Learning Objectives
-
Done: We checked to make sure we could log in to the sim UI at mtl.how/sim.
-
Do: We will upload our team data to the sim UI and review our data in the Experiments section.
Learning Objectives for Session 5 - After this session you will be able to:
- Describe the team data in the Experiments section.
- Test out the simulation user interface for more information about team data.
- Apply clinical expertise to consider the decisions the team makes that affect these data variables.
Start Participatory Learning from Simulation (30 minutes)
![]() ____________ Time 00:10-00:20 – Review participatory learning from simulation concepts
____________ Time 00:10-00:20 – Review participatory learning from simulation concepts
-
In sessions 2 and 3, we reviewed use of data UI to examine team trends over the past two years WHAT IS
- Cite example of what team noted in team data: For example, we saw that…
- Cite example of what team noted in team data: For example, we saw that…
-
Focus of today is use of simulation user interface or SIM UI is to explore WHAT IF
- We will ask WHAT IF questions about different decisions the team could make, hypothesize about the results, and examine findings to inform future decisions.
Start In-session Exercise (30 minutes)
![]() ____________ Time 00:15-00:25 – Confirm team lead for the day and upload data file to SIM UI
____________ Time 00:15-00:25 – Confirm team lead for the day and upload data file to SIM UI
1. In session 3, we used our team data UI and clicked “Create Team Data Table” to produce our team data for simulation.
- Identify team lead
2. Let’s now go back to mtl.how/data in your browser window to check the name of our team_data_table file
- Guide team lead to mtl.how/data and then to the team_data_table file
3. The team data file for simulation is in our team folder, in the team_data_table folder.
- Navigate to the team_data_table folder and click the “dot-dot-dot” so you can copy the filename of your team_data_table
4. Guide team lead to log in to the sim UI.
-
Open a new browser window in Chrome or Edge and go to mtl.how/sim
- Enter log in credentials: user name is VA email and password was provided to the team in the email sent last week.
-
Click the down-arrow in the Please select a World pop-up. Two options:“team” and “ind” for “individual”. Since we’re working together now as a team, choose the team world. If you are exploring the sim UI on your own, it’s best to select your individual world.
-
Note the SIM UI application has a responsive web design, so it adjusts the page layout to optimize to your screen’s dimensions
- If there is a critical issue that everyone needs to be alerted to, there will be a red “Alert” pop-up upon login.
5. Orient yourself to the home page (Team name, navigation icons, player name, welcome text, sections with blue headers).
-
From top left MTL logo - acts as a Home button - to right, six navigation icons: Home, Play, Team, More Info, News, Report Bug, Tutor and Logoff. Click on each to help the team understand purpose for each.
- Highlight importance of logging off
-
Click on the “Community” button on the bottom right if you have an idea, like something, or have a question.
Community of Practice (CoP) contains FAQs and if you set up a GitHub account, you can ask your questions directly in the CoP or email MTL at mtl.help@va.gov
Never include any PII/PHI in descriptions and screenshots unless you are emailing mtl.help@va.gov. The Community of Practice is a public platform.
-
Review MTL welcome text below the top navigation bar. Review the 3 section headings in blue bars: Session, Experiment Maintenance, and Team Data Dropdown Maintenance.
-
Whenever you see blue bars like these with a white triangle on the right, that means those sections can be expanded and collapsed by clicking on the bar.
-
If you’re not designated as a Team Lead, you won’t see all of these features. But everyone is the “Team Lead” for their individual world, so will see all of these sections when you’re logged in there.
- Review Experiment Maintenance section - delete, rename, or export experiments.
-
Whenever you see blue bars like these with a white triangle on the right, that means those sections can be expanded and collapsed by clicking on the bar.
6. Start a New Session [ ![]() __ ]
__ ]
Start a New Session and review the sim UI Main Page.
Select the module your team decided to use.
Select the team data you just uploaded.
Click Play. (For the Care Coordination and Medication Management (CC & MM) modules, after you click Play, you need to select your Learning Mode.) Refer to the Care Coordination (CCParams) or Medication Management (MMParams) tab of the Team Data Table at mtl.how/data, for data regarding the team’s New Patient Start Rates and Return-to-Clinic Intervals.
Note: Once you pick a Learning Mode to prioritize the New Patient Start Rate or the Existing Patients Return-to-Clinic Visit Interval, this will be the setting your team will experiment with through Session 12 for the rest of the Modeling to Learn program.
Existing Patient Return-to-Clinic Visit Interval: Choose this learning mode to prioritize the Existing Patients Return-to-Clinic Visit Interval (RVI) estimated from team data, and only start new patients in remaining open slots after the existing patient RVI, appointment supply, and missed appointments are all taken into account.
New Patient Start Rate: Choose this learning mode to prioritize the New Patient Start Rate estimated from team data, and only see existing patients in remaining open slots after the new patient start rate, appointment supply, and missed appointments are all taken into account. Upon clicking icons like “Play,” “Run,” or "Reset,’ a quick tip will appear on the loading screen on different functions in the sim UI.
7. Orient yourself to the Main Page of the Sim UI (Notice the same information and buttons at top; 4 sections with blue header - one showing the module and team data selected in its header; the others headed Outputs and Text, Experiments, and Text).
- You see the same information and buttons across the top as the Home page.
- There’s a new set of sections with blue headers below that. Let’s click inside the large blue header on the left to minimize that section, because we aren’t going to need it today. But notice inside that bar it tells you which module and team data file we selected.
-
To the right of the main section are 3 blue bars labeled Outputs and Text, Experiments, and Text.
- You can drag the Text section around by the blue bar. You can also expand, minimize, or close it with the icons on the top right side of the blue bar.
- Expand it to open up the Outputs section, including the Text boxes. Reduce it back to Text-only the same way you expanded it.
- If you close it with the X, you can get it back by going to the Outputs and Text section and selecting Expand.
- You can use the app’s responsive design feature to enlarge the view. Use the magnifier (+/-) or the shortcut Control/Shift/+ (or minus) to make things bigger or smaller. At some point, the design layout changes to stacked sections instead of having them side by side. This is the way it will look on a smartphone screen, or sometimes with other types of monitors.
- Record the team’s high-level learning Question.
- Open and expand the Outputs and Text section if you need to.
- Type your question about _________________________________ into the Question box.
- Click Save. We will discuss naming more next time. For now, just click the down arrow at the first prompt and choose “bc” (stands for base case), and Add, then click the Save button at the top. (We do not want to “save and reset”.) Click Yes at the prompt.
- Check out the Team Data Table.
8. Expand the Experiments section and read the “i” information for the Team Data Table.
- Open the section by clicking on the white down arrow in the right corner of the blue bar.
- The data in this table come straight from the file we just uploaded. In fact, throughout the sim UI, we’ve used the convention that red font means “read in from team data”.
- Click on the “i” in the red circle next to Team Data and read the “i” information. Throughout the Sim UI, we use “i” symbols for information pop-ups. Here, the “i” information is telling you how the data that you record, that you reviewed and chose in the data UI, are used to calculate or estimate the values in this Team Data Table.
- What types of decisions does the team make that affect these variables?
- Close the “i” information and look over the values - how do they strike you? Do they line up with how you think things are in your team? In particular, notice
9. Find the Team Data Table variables in the system diagram at the left.
- True Missed Appointments %
- Appointment Supply
- Return Visit Interval
- Engagement Duration
- New Patient Start Rate (AGG)
10. Log out of the Sim UI.
- That’s it for Modeling to Learn how to log in to our team world!
Have Team Lead pull up the session 05 SEE guide Done/Do review.
-
We logged in and uploaded our team data table to the sim UI, and reviewed our team data in the Experiments section.
- Check the “i” information available in the sim UI Model Diagram and Experiments section.
DO demo
- For next time, if you can, log in to to the sim UI at mtl.how/sim.
- Remember that when you first enter your log-in credentials, you’ll be able to choose between your Team world and your Individual world. If you choose your Team world, it will already have a “session” started - because we did that today when we chose the module and selected the team data file that we had added. So you will choose Join Current Session and click Play.
- If you’re ambitious to dig in and “play” in the sim, you can choose your Individual world and add the team data to the team data menu the same way we did just now. Then you can choose the module, select the data, and click Play. You can explore to your heart’s content in your Individual world without worrying that you’ll “break” anything or change anything for the rest of your team.
- Whichever way you get to hitting Play from the Sim UI landing page, it will take you to the main page for the module. We encourage you to explore the interface more.
- In particular, check out the “i” information available throughout the sim UI - in the Experiments section and in the model diagram - to prepare for our next session.
5.2.12 Session 06 Say Guide

MTL Live Session 06
Today we’re modeling to learn how to tell a systems story.
Hello! I’m ________________ (facilitator’s name) and I’m _______________ (co-facilitator’s name). Today we’re modeling to learn how to tell a systems story.
Done and Do (15 minutes)
Navigate to the SEE guide to show Done and Do.
![]() _____________ Time 00:00-00:10
_____________ Time 00:00-00:10
As you see in the Done and Do table of your Learner See Guide.
| We logged in to mtl.how/sim and reviewed the “i” information in the Model Diagram and Experiments section. |
We will tell a systems story about the team’s top priority of __________ using the Model Diagram in the sim UI. |
Emphasize team priority with the learning objectives on the screen.
After this session you’ll be able to:
![]()
Learning Objectives
Describe the systems story of your team’s highest priority.
Test out your thinking about causes of team challenges using the model diagram.
Apply clinical expertise to develop a question for team learning using simulation.
In-session Exercise (30 minutes)
Start in-session exercise and provide team-specific rationale for building capacity for participatory learning from simulation.
![]() _____________ Time 00:10-00:15 - Team-specific rationale __________________
_____________ Time 00:10-00:15 - Team-specific rationale __________________
The purpose for this activity is to familiarize you with the model diagram and how causal diagrams can be useful to understanding why problems arise and persist. By the end, you should be able to easily navigate it and find detailed information about each variable. This exercise has two parts, the first to practice navigating to your Team simulation world, and the second to use the diagram to help you tell your Systems Story. A Systems Story is a description of the causal connections that create the problem your team prioritized, _________________.
Team lead shares Chrome and logs in to the Team world at mtl.how/sim.****
![]() _____________ Time 00:15-00:20 - Team’s Session 05 Question __________________
_____________ Time 00:15-00:20 - Team’s Session 05 Question __________________
Let’s explore the MTL Home Page.
To start this session, you should log in to your team world at mtl.how/sim, where you enter your username (email address) and password. After you click LOGIN, a pop-up box will appear with the text “Please select a World” on the blue bar. Select the world that ends with “team” from the drop-down menu.
Once you’re on the MTL Home Page, look over on the left section with Session in the blue heading bar.
Since we logged in to the Team World last time, you’ll see the name of the module and the dataset we chose under the first option, Join Current Session. Select that and hit Play.
Now check what you’re seeing against what we’re showing on the screen. It should have your TEAM name at the top left, and YOUR name and photo at the top right, and YOUR team’s dataset listed in the blue bar of the main section above the model diagram, here.
Also, depending on the size of your monitor and whether your browser window is full-screen or less, you might see more or less than what we’re showing of the model section. The model screen is a dynamic graphic, so the main model diagram will adjust if you re-size the browser window.
- On a PC, you can re-size your screen to get more or less of the diagram to show up at once by clicking the stacked boxes icon in the far top right of your computer screen.
- On a MAC, to view the model in full screen click the green button in the upper left of the browser on your computer. To exit full screen, hover at the top of your computer screen, the toolbar will appear, click on “View”, click on “Exit Full Screen.”
Navigate to Text section to pull up the Question from last time.
In-Session Exercise - Part 1
Introducing the Simulation User Interface Main Section with the Model Diagram in relation to team’s priority.
![]() _____________ Time 00:20-00:30 - Team Priority__________________
_____________ Time 00:20-00:30 - Team Priority__________________
Now we’re ready to explore the simulation user interface main section with the model diagram in relation to your team.
1. Over what time frame does an experiment run?
See the box titled Experiment Timeline in the top corner of the diagram section. This shows the time frame over which an experiment will run. What is the maximum time into the future you can simulate? Two years from today.
2. Where do you find the descriptions for each variable in the module? Paste a portion of a description from one of the Rates into the chat box.
Notice the blue circle “i” in the diagram. These provide information on how model variables are calculated by the sim UI from the red variables that are read in from team data. The small circles with i inside throughout the sim UI provide additional information when you click on them. Red circle “i” in the team data table provides information for the red variables that are read in from team data. Circle “i” in the Experiments section provides information on what you’re changing when you adjust a variable to run an experiment.
3. Describe in one sentence what happens in the model diagram as you “Reveal Complexity?”
Inside the Experiment Timeline box you also see a set of options to Reveal Complexity. You can select check-boxes to bring more of the model diagram into view, or uncheck the boxes to make it less visually complex. The amount of detail showing in the model diagram does NOT affect your experiments; the model always accounts for all the complexity regardless of how much is being viewed at the time.
4. What is the significance of the variables in the “red boxes”?
In our convention, Red means read in from team data.
In-Session Exercise - Part 2
Introducing stocks/flows and polarities among key variables related to the team’s priority.
![]() _____________ Time 00:30-00:40 - Team Priority__________________
_____________ Time 00:30-00:40 - Team Priority__________________
- Starting Point: Main model section with no additional complexities revealed.
Tip: If you are not able to see the whole model diagram at once, try altering the size of the window using the browser’s expand/reduce button and dragging the frame. The display will adjust to a stacked format that will get more of the diagram into one view.
- Imagine a veteran in care. Tell the systems story told by the diagram in real-life terms. Make notes where you have questions or are unsure about the relationships depicted. Describe the connection between the model diagram and the team data table. How are they linked?
- What are the main units Modeling to Learn?
- Appointments/week
- Patients/week
- Episodes of Care (SP): Episodes of Care appears on the model diagram for Measurement Based Stepped Care and Suicide Prevention and in the Team Data Table. However, all of the Output charts are still in the units of appointments, appointments/week, patients, or patients/week.
- What are the main units Modeling to Learn?
- Let’s do a quick orientation to the model diagram.
- The navy blue circles or gauges are always a rate. The navy blue rectangles are patients or appointments.
- In telling a systems story, we want to trace the loop all the way around until we are back where we started - so that we close the feedback loop and fully understand why behaviors happen in our clinics.
- On the model diagram, you see plus and minus signs next to the blue lines. Use Thumbs to demonstrate +/- concept:
- If there is a plus sign between two variables, this means they move in the same direction (thumbs both up for increasing or both down for decreasing).
- If there is a minus sign, the two variables move in opposite directions (1 thumb up, 1 thumb down; and reverse).
Cover complexity reveal (causal loop) and base case question and dynamic hypothesis related to the team’s priority.
![]() _____________ Time 00:40-00:50 - Team Priority__________________
_____________ Time 00:40-00:50 - Team Priority__________________
Walk-throughs of each loop in each module are included in a table below.
Enter a base case question and hypothesis in the Text section.
- In the Question box, add a base case question about no new decisions in addition to the team need question that the team wrote last session.
- In the Hypothesis box, briefly describe what you expect to happen over the next two years if the team continues with business as usual.
- Click on the Save (not Save & Reset) button in the upper right corner of the Text section. This will allow us to quickly pull it up at the next session.
- The last thing to do is log out of the SIM UI!
![]() 00:50-00:55
00:50-00:55
That’s it for Modeling to Learn how to tell a systems story. Next is our Done/Do review.
Today we told a systems story about our team’s top priority and entered a Question and Hypothesis in the Text section. Before next time, please log into your individual world and refine your Question and Hypothesis about the base case experimental run in the Text section.
Done and Do (15 minutes)
Have Team Lead pull up the session 06 SEE guide Done/Do review.
![]() _____________ Time 00:50-00:55
_____________ Time 00:50-00:55
| We told a systems story about our team’s top priority and entered a question and hypothesis in the Text section. |
Log in to our individual world at mtl.how/sim. and refine the question and hypothesis we entered during the session about the Base Case run in the Text section. |
DO demo
- Log back into the SIM UI.
- Write your QUESTION about the base case (of no new decisions) in the QUESTION box.
- Write your HYPOTHESIS about the base case (of no new decisions) in the HYPOTHESIS box.
- Name your bc run. Use the drop down file naming field boxes to select ‘bc’. Click on Save (but not Save and Reset).
Until next time, thanks for Modeling to Learn!
Table of System Stories
| MODULE | – Loop – |
|---|---|
| CARE COORDINATION | – Wait Time Affects Referrals – |
| We’ll reveal the “Wait Time Affects Referrals” detail in the Care Coordination or CC model diagram. Then, scroll down to the lower left of the model diagram to see what has been revealed. Remember, if you’re not sure how a variable is defined, check the i descriptions on the model diagram or in the Experiments section. The Wait Time Affects Referrals detail shows the connection between patient Referral Rates, patients Waiting to Start CC and Target Wait Times for patients. For this activity of telling a systems story, we are concerned patients are having to wait longer than we would like to start Care Coordination. | |
| So, we’ll start this systems story with the Referral Rate - the green box. As a clinician you know that when Referral Rates increase, there is an increase in the back log of patients Waiting to Start a service, in this case CC. As the patients Waiting to Start increases, the average New Patient Wait Time starts to climb. Note the plus sign from Waiting to Start to New Patient Wait Time which indicates they will move in the same direction. So, if the patients Waiting to Start decreases, the New Patient Wait Time will decrease also. Let’s continue with the assumption that New Patient Wait Time is increasing. As this wait time increases, it increases the Effect of Wait Time on Referrals which decreases the Referral Rate so referrals to CC begin to slow down. Patients may be kept in or referred to other services so that they don’t have to wait longer than the desired or target wait time for their first CC appointment. In addition to running experiments around our Target Wait Time, this loop shows that we can also experiment with team decisions about Referral Rate. We can ask questions like, “If the Referral Rate to CC goes up by some percentage because we’ve started graduating patients more quickly from other services - but our Starting Rate in CC stays the same because we don’t have any extra appointment slots for new patients - what will become the ‘new normal’ for New Patient Wait Times in CC?” | |
| MEDICATION MANAGEMENT | – Wait Time Affects Referrals – |
| We’ll reveal the “Wait Time Affects Referrals” detail in the Medication Management or MM model diagram. Then, scroll down to the lower left of the model diagram to see what has been revealed. Remember, if you’re not sure how a variable is defined, check the i descriptions on the model diagram or in the Experiments section. The Wait Time Affects Referrals detail shows the connection between patient Referral Rates, patients Waiting to Start MM and Target Wait Times for patients. We hear a lot of clinicians say that good, ethical treatment is if you start a patient on medication assistance, the patient should come in for a monthly evaluation. If a clinician isn’t sure they can get a patient in for a monthly appointment, then they may decide not to start the patient on the service. For this activity of telling a systems story in the Med Management module, we would like to explore how our team can serve more patients with specific conditions, like Opioid Use Disorder (OUD), with our existing staffing levels. | |
| We’ll start this systems story with the Referral Rate - the green box. As a clinician you know that when Referral Rates increase, there is an increase in the back log of patients Waiting to Start a service, in this case MM. As the patients Waiting to Start increases, the average New Patient Wait Time starts to climb. Note the plus sign from Waiting to Start to New Patient Wait Time which indicates they will move in the same direction. So, if the patients Waiting to Start decreases, the New Patient Wait Time will decrease also. | |
| Let’s continue with the assumption that New Patient Wait Time is increasing. As this wait time increases, it increases the Effect of Wait Time on Referrals. The Effect of Wait Time on Referrals is the difference between the New Patient Actual Wait Time and the team’s desired or Target Wait Time. In the Med Management module, we can adjust target wait times for different diagnostic patients. The “stacked” red boxes labeled Target Wait Time indicates you can change the target wait time by adjusting the red sliders read in from your team data for patients with Alcohol Use Disorder, Opioid Use Disorder, Depression and Other conditions. The effect of an increasing wait time on referrals, which has a negative sign, means a decrease to the Referral Rate so referrals to MM begin to slow down. Patients may be kept in or referred to other services so that they don’t have to wait longer than the desired or target wait time for their first MM appointment. | |
| PSYCHOTHERAPY | – Balancing Existing and New Patients; Engagement After 3 Months – |
| The Psychotherapy or PSY module shows how team psychotherapy decisions interact, and depicts patterns of psychotherapy engagement in your team. You can explore solutions to the challenges of getting patients to complete a full course of therapy, while also achieving goals to start enough new patients in psychotherapy. Insights about these dynamics can be used to increase the local reach of evidence-based psychotherapies. We’ll reveal the “Balancing Patients” detail in the PSY model diagram. Remember, if you’re not sure how a variable is defined, check the i descriptions on the model diagram or in the Experiments section. For this activity of telling a systems story, we want patients to complete a full course of PSY without decreasing the new patients that can start psychotherapy. So, if you as a clinician are totally full in your PSY slots, the only way you can start new patients is if patients quit or patients complete. Let’s scroll down the model diagram to see what has been revealed in the blue shaded box titled Patients in Their First 3 Months of Psychotherapy. | |
| The Reveal Complexity detail for Balancing Patients shows the flow of patients and appointments in the PSY model. We see patients start psychotherapy and a certain number of patients get their first visit of PSY and end there; you can see this in the model here [use mouse to show “Patients in First Visit”]. We know that other patients will go on for additional visits. In the model diagram, we can explore data for patients who attend 2 to 7 visits [use mouse to show “Patients in Visit 2 to 7”] but they haven’t yet completed a full course of PSY. Next, there is a subset of patients will go on to achieve 7 or more visits in their own first 3 months. Some will graduate and some will continue treatment after 3 months. Obviously our team wants patients to complete a full course of PSY without decreasing the new patients that can start. | |
| So, starting on the left side of the screen in the blue box. We can see that as the Starting Rate for PSY increases, it increases the Booking Rate. Remember, we follow the blue line upward to Booking Rate and there is a plus + sign which means the Starting Rate and Booking Rate move in the same direction. As the Booking Rate increases, this increases the appointments on the books for PSY [use mouse to show booking rate to appointments in PSY]. As the overall appointment supply goes up it can increase the overall appointments for new patients or existing patients. So, as the Appointments in Psychotherapy increases, we follow the light blue arrow to Appointments for Existing Patients and see that plus + sign indicating an increase in appointments on the books for existing patients. As the appointments for existing patients goes up, it decreases the appointments for new patients, as this goes down it decreases the Starting rate as shown with the long blue arrow down the left side of the screen that connects Additional Appointments Available to New Patients to Starting Rate with a plus + sign. | |
| AGGREGATE | – Appointment Backlog Extends Return Visit Interval (under RVI and Wait Times) – |
| Because the Aggregate or AGG model includes a mix of services, the Experiment Timeline box has two options: Reveal Complexity and Display Patient Services. If you click through the services listed under Display Patient Services you will see the numbers change in the dark blue circles and rectangles in the model diagram. This represents the our team’s appointments and patients data for each service. Remember, if you’re not sure how a variable is defined, check the i descriptions on the model diagram or in the Experiments section. Let’s show the “RVI and Wait Times” under Reveal Complexity in the AGG model. Our team is going to be losing two staff members in the near future. Since the aggregate module shows the interactions between all services offered by our team, we want to use this module to explore how we can best allocate appointments across services with reduced staffing levels. We also want to know what will happen to patient wait times if we change patient return-to-clinic visit intervals (RVI) and/or if the remaining staff members decide to work overtime or not. | |
| Let’s walk through a systems story focused on the balancing loop titled "Appointment Backlog Extends Return Visit Interval right here on the model diagram [mouse over balancing loop on screen]. Let’s start In the Appointments section of the diagram with the Booking Rate. As the Booking Rate goes up, the Appointments increase. If there are more patients who need an appointment then there are appointments or clinical hours available, clinicians may feel work pressure. This is the light blue arrow with the plus + sign leading from Appointments to Work Pressure. | |
| When a clinic team experiences increasing Work Pressure then there is an Effect of Work Pressure on Scheduled Return Visit INterval such that as work pressure increases, there is an increases the time between appointments or the Return to Clinic Visit Interval. As the Return to Visit Interval increases the Booking Rate decreases, you can tell this by the negative sign at the end of the light blue arrow leading from RVI to Booking Rate. Thus, the balancing loop is Appointment Backlog Extends Return Visit Interval is complete. | |
| MEASUREMENT-BASED STEPPED CARE AND SUICIDE PREVENTION | – Higher Care Quality Improves Recovery – |
| Starting with Patient Load, which is [CLICK ON I TEXT AND READ], one way that increasing patient load influences the team is the effect on care quality. If the team has fewer patients than they can effectively treat, then the effect on quality decreases, and the care quality delivered to patients increases. When Care Quality increases, the number of patients in the grey box labeled Effect of MBC on Patient Symptoms and Risk decreases, which then decreases Patient Load, further increasing Care Quality. Let’s zoom in to this part of the diagram to see how that works by clicking on the plus sign in the upper right corner of the grey box [CLICK ON MEASUREMENT BASED CARE VIEW]. | |
| Here we see some of our same variables, including Care Quality, which has the same causal relationships in this view as in the previous view. When Care Quality goes up, two things happen: First, high-symptom patients improve faster than before (see the arrow to “Time to Improve” which affects the number of patients each week whose symptoms improve enough to be eligible to be stepped down to a less intense level of care), and Second, patients with high risk flags improve faster than before (see the arrow to “Time to UnFlag” which affects the rate at which patients with high risk flags have those flags removed). | |
| This causes more patients to flow into the “low symptom” group, so more patients can both end their care and be recommended to step down to a lower level of care. Now, click any one of the plus signs in a grey box to zoom out to the previous view [TOGGLE BACK TO STEPPED CARE VIEW]. As more patients leave this setting, it further reduces the total number of patients in the GMH treatment setting, thus further decreasing the patient load and increasing quality. When moving this direction, this type of reinforcing loop is often called a “virtuous circle.” However, this feedback loop also works in the opposite direction, where small increases in patients can lead to lower quality, more patients staying with “high symptoms,” resulting in even higher patient load. When this happens, this same loop is referred to as a “vicious circle,” or a “death spiral.” We have closed the loop, or brought our chain of causation full circle, and can now explain how this reinforcing loop of “Higher Care Quality Improves Recovery” could both energize our improvement efforts, or potentially derail them. | |
| – Higher Care Quality Improves Recovery Loop – | |
| In the Stepped Care View, start with Patient Load, which is the ratio of the total number of patients seen over the manageable total patients (i.e., demand over supply). One way that increasing patient load influences the team is the effect on care quality. If the team has fewer patients than they can effectively treat, then the effect on quality decreases, and the care quality delivered to patients increases. In the clinic, there could be many possible reasons for this effect: providers have more time to document and prep for each visit, more time to discuss cases as a team, more time for reminder calls, so more patients actually show up for their appointments, etc. | |
| When Care Quality increases, the number of patients in the grey box labeled Effect of MBC on Patient Symptoms and Risk decreases, which then decreases Patient Load, further increasing Care Quality. To see why this happens, zoom in to the part of the model that covers what happens inside the team (in the Measurement Based Care View). Here we see some of our same variables, including Care Quality, which has the same causal relationships in this view as in the previous view. When Care Quality goes up, two things happen: First, high-symptom patients improve faster than before (see the arrow to “Time to Improve” which affects the number of patients each week whose symptoms improve enough to be eligible to be stepped down to a less intense level of care), and Second, patients with high risk flags improve faster than before (see the arrow to “Time to UnFlag” which affects the rate at which patients with high risk flags have those flags removed). | |
| This causes more patients to become part of the “low symptom” group, so more patients can now both end their care and be recommended to step down to a lower level of care. Back in the Stepped Care View, as more patients leave this setting, patient load drops even farther, and quality increases even more. When moving this direction, this type of reinforcing loop is often called a “virtuous circle.” However, this feedback loop also works in the opposite direction, where small increases in the number of patients in care can lead to lower quality, more patients staying with “high symptoms” longer, resulting in even higher patient load. When this happens, this same loop is referred to as a “vicious circle,” or a “death spiral.” We have closed the loop, or brought our chain of causation full circle, and can now explain how this reinforcing loop of “Higher Care Quality Improves Recovery” could both energize our improvement efforts, or potentially derail them. | |
| – Work Pressure Delays Care Decisions Loop – | |
| In the Stepped Care View, start with Patient Load, which is the ratio of the total number of patients seen over the manageable total patients (i.e., demand over supply). One way that increasing patient load influences the team is the effect the team’s ability to assess and develop effective treatment plans for each patients. If the team has fewer patients than before, then they have more time to focus on patients early in care, who still need to establish whether or not a patient is high symptom and start them on an effective treatment plan. In the Measurement Base Care View, this effect directly impacts the variable “Time to Detect,” where an increase in the Patient Load causes the Time to Detect to increase, and vice versa. There is no limit to the positive effect decreasing workload has on providers’ ability to assess patients and develop effective treatment plans. | |
| This causes more patients to move through their care journey faster than before, so, all else being equal, more patients end treatment or step down to a lower level of care than before. Back in the Stepped Care View, as more patients leave this setting, patient load drops even farther, and Time to Detect falls even more. When moving this direction, this type of reinforcing loop is often called a “virtuous circle.” However, this feedback loop also works in the opposite direction, where small increases in the number of patients in care can lead to higher Time to Detect, more patients staying in the “Early in Care” status longer, resulting in even higher patient load. When this happens, this same loop is referred to as a “vicious circle,” or a “death spiral. We have closed the loop, or brought our chain of causation full circle, and can now explain how this reinforcing loop of”Work Pressure Delays Care Decisions " could both energize our improvement efforts, or potentially derail them. | |
| – Work Pressure Reduces Access Loop – | |
| In the Stepped Care View, start with Patient Load, which is the ratio of the total number of patients seen over the manageable total patients (i.e., demand over supply). One way that decreasing patient load influences the team is the effect the team’s ability to start new patients. If the team has fewer established patients than before, then they have more open slots on their schedule for new patients. This effect directly impacts the “Total New Episode of Care Start Rate” (“Total” referring to the fact that this rate is all new episodes of care, regardless of where a patient is coming from). This effect seeks to represent the physical reality of having a schedule based on a fixed team capacity, where the team can only offer so many hours per week. There is no limit to the detrimental effect increasing workload has on start rate – a high-enough Patient Load could cut new care episode starts to zero. | |
| Any initial increase in the episode of care start rate is quickly undone, as these new patients become established patients, and their recurring appointments fill up the more and more of the open slots on the schedule. The limiting factor of team capacity prevent this initial change from being sustained. This is also true of a decrease in the start rate, as a team that starts fewer new patients but has the same number of patients leaving (either ending or stepping up/down) will soon have more open slots than they had before, allowing the start rate to increase. A feedback loop that counter-acts change is called a “balancing loop,” as any initial change will be washed out in the long run. This type of loop is helpful in maintaining performance, but if ignored, can often lead to unstained improvement efforts. | |
| – Access Pressure Increases Patient Starts – | |
| In the Stepped Care View, start with “Patients Waiting to Start Care,” which is the total number of patients who have been referred to this team, regardless of where they are coming from. If there are more patients waiting than before, then the wait time to start with this team increases above the acceptable value (the “Desired Wait Time,” which is estimated from the team’s data), and the team feels more pressure to start these patients to bring wait times back down. The team will then start more new episodes of care than before to alleviate the high wait time, even if they don’t have the capacity to effectively treat these patients. This effect is limited to 2x, as even the highest increase in wait times could only double the original episode of care start rate. | |
| As the team starts more episodes of care, the number of patients waiting drops, and the wait time falls back to the desired wait time. This is also true if the team experiences a decrease in wait times, as the team would then start fewer new episodes of care than before, until the wait time rose back to the desired value. A feedback loop that counter-acts change is called a “balancing loop,” as any initial change will be washed out in the long run. This type of loop is helpful in maintaining performance, but if ignored, can often lead to unstained improvement efforts. | |
| – Overwork and Burnout Reduce Care Quality – | |
| In the Stepped Care View, start with Patient Load, which is the ratio of the total number of patients seen over the manageable total patients (i.e., demand over supply). One way that increasing Patient Load influences the team is by increasing the team’s fatigue. If the team experiences a sustained increase in fatigue, eventually the total patients the team can manage effectively decreases (as providers have less time for each patient, make more mistakes, and take more sick days). If sustained for long enough, high fatigue will cause burnout and providers leaving the team, which drastically reduces the number of patients the team can manage. | |
| Unless something else changes in the team, as fatigue and burnout continue to build up, Patient Load will grow even more (the denominator is reduced, thus the ratio increases), forcing remaining providers to work even hard than before, and Manageable Total Patients falls even more. When moving this direction, this type of reinforcing loop is often called a “vicious circle,” or a “death spiral.” Unfortunately, this systems story doesn’t work the other way, as below-average workload cannot increase supply – we assume that no individual provider will book more appointments just because their team has fewer patients across their panels (shrinking numerator) or the team gets a new provider (growing denominator). |
5.2.13 Session 06 Say Checklist
Today we’re modeling to learn how to tell a systems story.
- Hello! I’m __________ and I’m __________. Today we’re modeling to learn how to tell a systems story.
Navigate to the SEE guide to show Done and Do
![]() _____________ Time 00:00-00:10
_____________ Time 00:00-00:10
-
Done: We logged in to mtl.how/sim and reviewed the “i” information in the Model Diagram and Experiments section.
-
Do: We will tell a systems story about the team’s top priority of _______________________________ using the Model Diagram in the sim UI.
Emphasize team priority with the learning objectives on the screen
- [ ] ![]()
Learning Objectives for Session 6
Describe the systems story of your team’s highest priority.
Test out your thinking about causes of team challenges using the model diagram.
Apply clinical expertise to develop a question for team learning using simulation.
Start in-session exercise and provide team-specific rationale for building capacity for participatory learning from simulation
![]() _____________ Time 00:10-00:15 - Team-specific rationale __________________
_____________ Time 00:10-00:15 - Team-specific rationale __________________
-
Provide rationale for building capacity for participatory learning from simulation.
- A Systems Story is a description of the causal connections that create the problem your team is prioritizing _________________.
Team lead shares Chrome and logs in to the Team world at mtl.how/sim****
![]() _____________ Time 00:15-00:20 - Team’s Session 05 Question __________________
_____________ Time 00:15-00:20 - Team’s Session 05 Question __________________
- Re-size your screen to get more or less of the diagram
- Select to continue with the same module
- Navigate to the experiment section to pull up the question on the team need from last time.
Introducing the Simulation User Interface Main Section with the Model Diagram in relation to team’s priority
![]() _____________ Time 00:20-00:30 - Team Priority__________________
_____________ Time 00:20-00:30 - Team Priority__________________
- Experiment Timeline Over what time frame does an experiment run? Two years from today.
- Blue circle “i” provide information on how model variables are calculated by simulation user interface, from the red variables that are read in from team data. The small circles with i inside throughout the sim UI provide additional information when you click on them. Red circle “i” in the team data table provide information for the red variables that are read in from team data. “i” in the Experiments section provide information on how the experimental variables are changing when you run the experiment.
- Reveal complexity shows more of the model diagram being shown but the model still accounts for all the complexity.
- Red variables are read in from team data.
Introducing stocks/flows and polarities among key variables related to the team’s priority
![]() _____________ Time 00:30-00:40 - Team Priority__________________
_____________ Time 00:30-00:40 - Team Priority__________________
- The navy blue circles or gauges are always a rate per week.
- The navy blue rectangles are stocks or states where patients or appointments accumulate.
- Close the feedback loop Trace the loop all the way around until we are back where we started.
- Use Thumbs + plus means two variables move in the same direction (both up/both down)-TEAM VARIABLES to EMPHASIZE ____________________________________________________
- Use Thumbs - minus means two variables move in opposite directions (1 thumb up, 1 thumb down)- TEAM PRIORITIES to EMPHASIZE ____________________________________________________
Cover complexity reveal (causal loop) and base case question and dynamic hypothesis related to the team’s priority
![]() _____________ Time 00:40-00:50 - Team Priority__________________
_____________ Time 00:40-00:50 - Team Priority__________________
- Cover the basecase values in the complexity reveal (causal loop) most relevant to the team’s highest priority need.
- As you tell the story, ENTER TEXT about a basecase question and dynamic hypothesis in addition to the team need question. What do you expect will happen over the next two years if the team continues with business as usual?
- Save (not Save & Reset) the text.
Have Team Lead pull up the session 06 SEE guide Done/Do review.
![]() _____________ Time 00:50-00:55
_____________ Time 00:50-00:55
- Log into your individual world at mtl.how/sim and refine the Question and Hypothesis about the base case experimental run in the Text section.
- Log out of the SIM UI!
- Team post session 06 email will be sent.
5.2.14 Session 07 Say Guide

MTL Live Session 07
Today we’re modeling to learn how to evaluate our Base Case of no new decisions.
Hello! I’m ________________ (facilitator’s name) and I’m _______________ (co-facilitator’s name). Today we’re modeling to learn how to evaluate our Base Case of no new decisions.
Start with a review of what was learned in the last session and what we will do during the session today:
| Time Stamp | Prioritize tailored team learning | Script |
|---|---|---|
| Review progress to date and learning objectives for this session | Practice describing specific learning/skills developed last session and confirm consensus on team’s highest priority need. |
| We logged in to our individual world at mtl.how/sim. We used the question we entered during the previous session and added our own hypothesis about the Base Case (bc) run in the Text section. |
We will run a “BC” simulation and review the impact of making no new decisions on ___________ [the variables relevant to the team’s question] in the MTL sim UI Outputs section. |
After this session you’ll be able to:
![]()
Learning Objectives
Describe the base case of no new decisions in your team.
Test out your thinking about what is likely to cause oscillation in team trends.
Apply systems thinking to develop a hypothesis about your team’s clinical priority.
After this review, pass control over to the team. Ask the Team Lead to log into the SimUI, join the current session, and share their screen.
| Time Stamp | Prioritize tailored team learning | Script |
|---|---|---|
| Cue up the team’s question from Session 5 and hypothesis from Session 6 Review the team data that supports the team’s question and the systems story that supports the team’s hypothesis. | Practice highlighting specific values from the Team Data table and variables from the complexity reveal (causal loop) that are guiding the in-session work to address the team’s highest priority need. |
In-session Exercise (30 minutes)
Running a Base Case
1. Log in to your team world at mtl.how/sim.
During the time it takes the team lead to start screen share and navigate to the sim, present the purpose of the exercise:
The purpose for this activity is to test the hypothesis you developed in the last session.
By the end, the team should be able to run an experiment in the SimUI, explore results, and be able to explain the systems causes that generated those results.
2. Join Current Session to pick up where the team left off.
3. Orient yourself to the main page: Team Name (when you’re in your individual world, the team name is your name); selected module (CC, MM, PSY, AGG, or SP); selected data file. All slider settings in the Experiments section are at Base Case or default values.
- “In the last session, you all created a question about your team’s top improvement priority and the Systems Story that surrounds that issue. Today we’re going to make that story come alive – we are going to run a simulation, and see the impact of these system causes over the next two years, as as function of our local capacities and constrains, as estimated with our local data. The first step in learning from simulation is to run a base case or “status quo” simulation against which all future experiments will be compared. Last time, you hypothesized that _____________ (include specific variables, loops, data)."
- Now, in the window floating on the right side of the screen, add to the team’s question about the Base Case in the Our Question text box. Here you’ll briefly describe what your team wants to learn from this experiment of no new decisions.
![]() Example Question to add: What happens to ______________ (from the team’s priority) if we make no new decisions?
Example Question to add: What happens to ______________ (from the team’s priority) if we make no new decisions?
There is important research showing that is not likely to improve learning to click around and run experiments without stating what you expect will happen over the next two years before you run the simulation.
In order to benefit from experiential simulation learning, you need to create a hypothesis – an if/then statement about what you believe will happen over the next two years as a consequence of your change. Through this process you can be surprised, have some things confirmed, but perhaps also find that when more variables and complexity are accounted for, there may be counter-intuitive findings too.
4. Expand the Outputs and Text section and enter text in the boxes to reflect your question and hypothesis about a base case run – one where no new decisions are made in your team, and run the simulation out to its 2-year end just using data pulled in from your team data file.
- Add your hypothesis about the base case run results in the Our Hypothesis text box. Reference team data value relevant to the team’s question. We want to be as specific as possible, and we have the question, hypothesis, findings and decisions boxes here, which the teams can use as a lab notebook to track their thinking. They can then save their work, so that they can efficiently pick up where they left off, which is critical when time for team huddles in the clinic is very tight.
![]() Example Hypotheses to add: Outline the systems story your team believes will cause the outcomes your team expects to observe.
Example Hypotheses to add: Outline the systems story your team believes will cause the outcomes your team expects to observe.
– Module specific Hypotheses, Findings, and Decisions are included in a table below –
| Time Stamp | Prioritize tailored team learning | Script |
|---|---|---|
| Run a simulation and save results | Ask the team lead to narrate this process. |
- Helpful tip: To run the Base Case, let’s first make sure that all the Experiment sliders are indeed set for the Base Case. When you look in the Experiments section, you should see that the box next to each slider says either zero or bc. If it says bc, it means the value the model will run is the number from the Team Data Table. A few sliders have a different setting. If you see a purple Sensitivity slider, it will start at a default value of 1, which is the mid-range, between no relationship between those two variables, and a very strong relationship. (And if there’s a Team Data vs Balanced switch, Balanced will be the default setting.)
5. Run, then Save (without resetting) the run with the name Base Case.
Once we’ve verified that sliders are set for the Base Case and we’ve entered our question and hypothesis, we’re ready to hit Run. (drum roll!)
Now let’s open the Outputs section and see what we find. The quick way to do this is to click the “expand” button in the blue bar of the Texts section.
This opens the full Outputs and Text section, which now shows all the Text boxes and a larger Results Dashboard where you can see several charts at once, and a Control Panel on the left.
Before we go further, it’s a good time to go ahead and Save this run.
Saving without Resetting will capture the text that we’ve written in the boxes and the settings and results of our run. We’ll still be able to enter more text to finish our consideration of this test as long as we don’t re-set the sim.
So, click on Save at the top and then click Yes. This warning is just a reminder of how important it is to record your thinking in the Text boxes so your learning from what you’ve done doesn’t evaporate.
The Save menu helps you enter a name for each run based on what sliders you moved. In this case, it’s the Base Case, so on the Variable drop-down menu just select Base Case and click Add.
You’ll see “bc” entered in the Experiment Name field and now you can click Save again in the top right.
Caution: Only choose the Save and Reset button at the bottom when you’re finished recording all you need to in the Text section. Or you can choose Discard if you weren’t ready to save or name the run.
| Time Stamp | Prioritize tailored team learning | Script |
|---|---|---|
| Describe findings/decisions and saving | Practice describing specific output charts (system behaviors) you’re going to check and discuss as a team in relation to their team’s highest priority need. |
6. Review the Current Experiment Values in the Control Panel: You should see all variables at base case or default values.
- This is where you can remind yourself of the settings for the current experiment or check to make sure they are what you meant to set.
7. Orient yourself to the charts in the Results Dashboard (axes, units, legend, drop-down menu options).
Now let’s look at the Results. Notice that each chart has a title below it and a drop-down menu. You have a wide selection of variables to choose from to look at results. The units are shown inside the chart at the top left – usually Weeks, Patients, Appointments, or a Percent, or a rate like Patients per Week.
The axes adjust dynamically – so even if the units of two side-by-side charts are the same, you have to check the scale before comparing them visually.
8. Describe what you see in the Our Findings textbox. What do you notice about the results for ________ [relevant to the team’s question]? Do they match your hypothesis? Compare the values in the charts with the Team Data Table numbers.
9. Record your Findings - what you learned from the Results compared to your Hypothesis.
- Add to the Our Findings text box your explanation for why the results do or do not conform to your hypothesis.
![]() Example Findings: Describe your team’s findings, insights and conclusions from this experiment.
Example Findings: Describe your team’s findings, insights and conclusions from this experiment.
| Time Stamp | Prioritize tailored team learning | Script |
|---|---|---|
| Come to consensus on the next experiment | Practice guiding the team to the highest leverage experiments (changes that will impact the most patients) that represent actions they could take today. |
10. In Our Decisions, record what these findings suggest doing differently in your team. Also write down what the team decided to investigate next.
- Now that we have an experiment to compare against, what changes do you want to test next? What is the first improvement idea you want to try as a team? Record this next step in the Our Decisions textbox.
![]() Example Decisions: Based on what you learned in this experiment, what changes are you ready to make in your practice?
Example Decisions: Based on what you learned in this experiment, what changes are you ready to make in your practice?
11. Save and Reset when ready. Notice that the sim UI automatically adds the date to the name of the run for you. Remember to log off before you exit the browser window.
That’s it for Modeling to Learn how to evaluate the Base Case of no new decisions. Next is our Done/Do review.
- Today we entered our Question, Hypothesis, Findings and Decisions for our base case run in the Text section. Before next time, please log in to mtl.how/sim and explore the results of the base case run in the Results Dashboard found in the Outputs and Text expanded view.
Done and Do (15 minutes)
| We entered our Question, Hypothesis, Findings and Decisions for our Base Case (bc) run in the Outputs and Text section. |
Log in to mtl.how/sim and explore the results of the bc run in the Results Dashboard of the Outputs and Text section to prepare for experiment 1. |
DO Demo
| Time Stamp | Prioritize tailored team learning | Script |
|---|---|---|
| Success - A successful Done/Do Review is short, specific, simple and shown. |
- Log back into the SIM UI, choose “Team world,” and “Join Current Experiment.”
- In the Experiments, select your bc run from the list of previous experiments. Click on GO check the box to include text. This will reload your prior QUESTION, HYPOTHESIS, FINDINGS and DECISIONS.
- Expand the Outputs and Text section (two clicks!) to reveal all the results and findings saved from the run. Review what you learned and what the team decided to try for Experiment 1. What is the question you want to answer with this experiment? What is your hypothesis about the results?
- Log out.
Until next time, thank you for Modeling to Learn!
Base Case Dynamics for each module
| Module | Example Text |
|---|---|
| CC & MM | Hypothesis: |
| If we make no new decisions then patients will start accumulating in “the waiting room” for care coordination. But then it will swing back the other way, and at some point the wait time will become steady at about the level it is now. This is because of the balancing that happens between using appointments for new and existing patients. The number of patients in care will stay constant. | |
| If we make no new decisions then we will reach the same proportion of our patients with medication assisted therapy for OUD. | |
| Findings: | |
| All variables will show no change over the next two years. Without any new decisions, the team will continue to experience their historically “normal” behavior. These flat lines could be seen as favorable, or not, depending on the team’s expectations. Example: “We can see our Return-to-clinic Visit Interval (RVI) in the base case is the same for all patient needs, but we’d like to better meet more specific needs of patients evidence-based pharmacotherapy (EBPharm).” | |
| Note: If team has prioritized data on “Existing Patient Return-to-Clinic Visit Interval,” then the RVI used by the team will match the estimate calculated from their patients’ data, but start rate generated by the model will not. If the start rate is higher than the estimate, then this implies that the team is actually working more efficiently (fewer missed appointments, shorter engagement durations, etc.) than we can see from the data or perhaps the 75th percentile we’re using to estimate their appointment supply is too conservative. If the start rate is lower than the data suggest, then the team could be facing more hurdles than we can see in the data, are seeing patients for longer, or perhaps the 75th percentile we’re using to estimate their appointment supply is too optimistic. | |
| Note: If team has prioritized data on “New Patient Start Rate,” then the start rate shown in the base case will match the estimate calculated from their patients’ data, but the RVI used by the team will not. If the RVI used by the team in the simulation is more frequent than the estimate, then this implies that the virtual team is either more efficient, has more capacity, fewer no-shows, or shorter engagement durations (or some combination) than the real-world team. If the RVI used by the virtual team is slower than the real team, then the opposite is true – that the real-world team is more efficient, has more capacity, fewer no-shows, or shorter engagement durations (or some combination) than we can see from their data. | |
| Decisions: | |
| Next time we will experiment with increasing our appointment supply by 5 appt/wk to attempt to reduce New Patient Wait Times. | |
| Next time we will experiment with increasing both our referrals to DEP and increasing those patients’ RVI to attempt to reduce our DEP wait times. | |
| PSY | Hypothesis: |
| If we make no new decisions then we expect that we will continue to see fewer Psy and EBPsy patients than we want because we aren’t graduating our psychotherapy patients. We hypothesis that the number of patients receiving an evidence-based dose of PSY is currently low, taking into consideration that Completers who Graduate is about 4% and that Initiators who Complete is just 37%. | |
| Findings: | |
| All variables will show no change over the next two years. Without any new decisions, the team will continue to experience their historically “normal” behavior. These flat lines could be seen as favorable, or not, depending on the team’s expectations. Example: Our team will continue to start ~3ppw, with the majority of our slots going to patients who have been in care after their first 3 months. Our completion rate will remain high (at 0.5 ppw), but our graduation rate will not improve, remaining at 0.04 implementation ppw (or one patient every 6 months). | |
| If the team is interested in how their supply is being used (the number of slots used by patients in their first 3 months, vs after), then the Sankey chart can reveal details on how many slots are currently used in each care pathways. Example: Based on the Sankey diagram, we understand that out of N=371 patients who have one PSY visit, n=289 are Initiators. Of these, only n=107 are Completers, and of Completers, on n=4 graduate after having an evidence-based dose of PSY (about 8 sessions in their first three months with the team). Patients who remain in care after their first three months take up the majority of slots, with patients who only get one visit in their first 3 months eventually taking 6 more visits before ending (thus never receiving a complete dose), and patients who complete but return taking 26 visits before ending (double the evidence base). | |
| Decisions: | |
| We can do much better. We can start by trying to increase the percentage of Completers who graduate, from 3.77% to as high as 75%. This will reduce the number of appointment slots used by patients who continue therapy after already receiving a complete dose, hopefully opening up more slots to new patients. | |
| AGG | Hypothesis: |
| If we make no new decisions, then, based on our team data, we expect to see that the majority of our patients will continue to receive MM. By far our MM and PSY patients have the longest engagement time and account for more than 40% of our services. Patients will continue to accumulate while waiting for care. | |
| Findings: | |
| Using the compare services features, our hypothesis is supported. Our baseline shows that we have more than 1000 MM patients in service, followed by PSY (about 300 patients), CC (about 260 patients), and by Adjunct (about 175 patients). Interestingly, patients receiving group services drops to about 100 patients at about 1.5 years into the experiment. Include dynamics = oscillations in xxxx caused by feedback loop…Drop in yyyy caused by | |
| Decisions: | |
| Ideally, we would like to reduce the median engagement time for both MM and PSY, as patients are receiving treatment time that is longer than recommended for PSY and the return visit interval time for PSY is also long (17 weeks between visits on average!). Reducing the engagement time should free up supply, while decreasing the RVI (i.e., meeting more frequently) should increase the slots used by our PSY patients. We hope to explore the trade-off between these two clinical decisions on our whole panel, and the ability to start new patients in PSY). | |
| SP | Hypothesis: |
| If we make no new decisions, then we expect to see no changes in care quality, performance, or wait times in all three settings – all the current historical averages for patients in care, step down rates, etc. will hold for the next two years. Patient risk will not improve. | |
| Findings: | |
| Since the teams in the simulation experience no external shocks and make no new decisions, the historical rates all continue for the next two years. We will still have about 4 patients with a high risk flag, and, if we click on the plus sign in the upper right corner of the “GMH to SMH Recommend Step up Rate” box and zoom out to see how our team is working with the rest of the Mental Health continuum, we see that we will continue to have about 57 high-symptom patients who are waiting to step up to Specialty Mental Health. If we look over to the Team Data Table, we can see that these patients are waiting an average of 28 weeks before starting treatment there. Now, if we minimize the table [CLICK ON THE RED ARROW] and open up “GMH Patients and Patients Waiting to Start,” we can see how many patients total are in care. Click on the “BC” button in “Manageable Total Patients” to see that we have 517 patients in care. Care quality does not improve (specifically, the team’s main concern of wait time to step up). However, if our manageable patient load stays the same over the next two years at the past two years, we shouldn’t expect things to get worse, either. | |
| Decisions: | |
| Given the high wait times to step to other settings and how hard it will be to reduce these wait times directly by working with leadership and the other teams, we should explore the effects of something that would be easier to implement - shift to using measurement-based care for all patients in our team - to see what both the positive and unexpected impacts will be. We expect that we will be able to both develop treatment plans faster and improve patients symptoms faster if we continually track their symptoms, hopefully engaging the “Higher Care Quality Improves Recovery” cycle. |
5.2.15 Session 07 Say Checklist
Today we’re modeling to learn how to evaluate our Base Case of no new decisions.
- Hello! I’m __________ and I’m __________. Today we’re modeling to learn how to evaluate our Base Case of no new decisions.
Navigate to the SEE guide to show Done and Do
![]() _____________ Time 00:00-00:10
_____________ Time 00:00-00:10
-
Done: We logged in to our individual world at mtl.how/sim. We entered in our own hypothesis about the Base Case in the Text section.
-
Do: We will run a “bc” simulation and review the impact of making no new decisions on ________________ in the MTL sim UI Outputs section.
Emphasize team priority with the learning objectives on the screen
Learning Objectives for Session 7
Describe the base case of no new decisions in your team.
Test out your thinking about what is likely to cause oscillation in team trends.
Apply systems thinking to develop a hypothesis about your team’s clinical priority.
Start in-session exercise and provide rationale for running a base case with no new decisions.
![]() _____________ Time 00:10-00:15 - Team-specific rationale __________________
_____________ Time 00:10-00:15 - Team-specific rationale __________________
-
Provide rationale for preparing for running a base case of no new decisions prior to running simulation experiments.
- The first step in learning from simulation is to run a base case simulation against which all future experiments will be compared.
Team lead navigates using Chrome to log in to the Team world at mtl.how/sim****
![]() _____________ Time 00:15-00:20 - Team’s Session 06 Question __________________
_____________ Time 00:15-00:20 - Team’s Session 06 Question __________________
- Join current session to pick up where the team left off in Session 06.
- Orient to main page: Team name, module, and selected data file.
- Pull up the team’s Session 06 question and dynamic hypothesis about the basecase.
Use session 6 complexity reveal (feedback loop) to explain the likely
![]() _____________ Time 00:20-00:30 - Team Priority Causal Loop__________________
_____________ Time 00:20-00:30 - Team Priority Causal Loop__________________
Specific Variables and Values from Priority Causal Loop_______________
- Use the causal system story in the model diagram complexity reveal for the team’s priority to “stake a claim” about what will happen over the next two years in the team if the team makes no new decisions.
- Example question: “What happens to ____________ (from the team’s priority), over the next two years if we make no new decisions?”
- Example hypothesis, using specific variables and values: “If we make no decisions in our team, then due to the Feedback Loop: Balancing New and Existing Patients, over the next two years, we will continue to see approximately 90 patients each week who have been engaged in care for longer than their first three months, and 25 patients each week who are in their own first 12 weeks of psychotherapy.”
Run the Base Case of no new decisions
![]() _____________ Time 00:30-00:40 - Team Priority__________________
_____________ Time 00:30-00:40 - Team Priority__________________
- Set all red and green experiment sliders to “bc” or “zero” except purple sensitivity sliders, which start with a default middle value of “1”.
- Hit the Green Run Button!
- Go to the Expanded Outputs section and Save (not Save & Reset) our run.
Describe the output charts of the specific variables and values related to the team’s highest priority need using Base Case data
![]() _____________ Time 00:40-00:50 - Team Priority__________________
_____________ Time 00:40-00:50 - Team Priority__________________
- Look at the results with the team specific to the team’s question and hypothesis for the bc run.
- What does the team notice about the results for variables related to their highest priority need?
- Describe team System Behavior findings in the Our Findings textbox
- How Basecase System Behavior findings are explained by Causal Loop Complexity Reveal for team’s priority:
- Decisions: Based on what the team learned in this base case experiment, what specific variables at what specific experiment values will the team use Modeling to Learn to learn next?
Have Team Lead pull up the session 06 SEE guide Done/Do review.
![]() _____________ Time 00:50-00:55
_____________ Time 00:50-00:55
- Done: We entered our Question, Hypothesis, Findings and Decision for our Base Case (bc) in the Text section.
- Do: Log into mtl.how/sim and explore the results of the bc run in the Results Dashboard of the Expanded Outputs section to prepare for experiment 1.
- Demo for team how to reload team’s prior Question, Hypothesis, Findings and Decision.
- Reminder to click “Save” and log out.
5.2.16 Session 08 Say Guide

MTL Live Session 08
Today we’re modeling to learn how to test a dynamic hypothesis.
Hello! I’m ________________ (facilitator’s name) and I’m _______________ (co-facilitator’s name). Today we’re modeling to learn how to test a dynamic hypothesis.
As you can see in the Done/Do table at the top of the Learner See Guide:
Done and Do (15 minutes)
| We logged in to mtl.how/sim and explored the results of the base case (bc) run in the Results Dashboard of the Outputs and Text section to prepare for experiment 1. |
We will test a dynamic hypothesis about ___________ by running experiment 1 and comparing results against the bc. |
After this MTL session, you will be able to:
![]()
Learning Objectives
- Describe the systems story your team believes will cause the outcomes you expect to observe in your experiment.
- Test your dynamic hypothesis about your team’s clinical priority.
- Apply systems thinking to describe your team’s findings, insights, and conclusions from your experiment.
![]() 00:05-00:10
00:05-00:10
Let’s get started! Who wants to drive today?
In-session Exercise (30 minutes)
Running an experiment
Providers know there are a lot of interdependencies that make improving care in the clinic challenging. Often, because we’re embedded in such a large care system, we may be “flying blind” with regard to how our own care decisions fit within all that is going on locally. We can use simulation to help reveal the connections and figure out which changes work, which don’t, and which are sustainable, a lot faster and safer than in the real world.
| Time Stamp | Prioritize tailored team learning | Script |
|---|---|---|
| Cue up last time q/h/f/d |
1. Log in to your individual or team world at mtl.how/sim.
2. If you logged into your individual world, review your saved runs in the Experiment Maintenance section. Rename your saved runs if you feel you need to.
- On the MTL Home page, you will see the “Experiment Maintenance” section in the middle. This is where you can review your saved runs by clicking the blue bar to expand the section.
- Here, you are able to Delete, Rename, or Export your experiments.
- A team may need to rename experiments if they want to be sure they are able to differentiate between experiments or if they incorrectly named a file in a prior session. If you need to rename any of your saved runs, check the box to the left of the file name, click Rename*, change the name, and Save.
3. If you logged into your individual world, review the data files you have uploaded in the Team Data Dropdown Maintenance section and make sure you have the data file you want.
- The section on the right side of the MTL Home page is “Team Data Menu Maintenance”. This lets you alter what you see in the drop-down menu for selecting a data file when you want to Start a New Session (in the Session section). You can Delete, Rename, or Add data files. You would not want to rename a data file unless you did not already have it entered exactly as it is named at mtl.how/data.
4. You can Join Current Session or Start a New Session in any module. If you Start a New Session select the team data file you’d like to use.
- If you Start a New Session you will need to select the team data file you would like to use for this session. Click the “Select Team Data” icon. A pop-up box will appear that says, “Please select a model input file.” Click to open the drop-down menu and choose the data file you would like to use.
5. To refresh your memory and pick up where you left off last time, select the experiment from the last session and check the box to include text from this session in Expanded Outputs Text fields. Review those text fields.
You will see the main, model diagram section, the Outputs and Text section, and the Experiments section, with a smaller, floating Text section. You can drag that section over or “X out” of it to make room to open the Experiments section. To pick up where we left off last time, expand the Experiments section by clicking on the blue bar. At the top you will see, “Select Previous Experiment to Set Experimental Values to a Former State.”
Time Stamp Prioritize tailored team learning Script  00:15-00:20
Review the team data the led to that q/h/f/d 1. Practice highlighting specific values from the Team Data table that are guiding the in-session work to address the team’s highest priority need. Open the drop-down menu for Select Experiment and select the base case experiment from the last session.
When you click the red “Go” button, a pop-up box will appear that says “Review Previous Settings.” Because you’ve selected the base case experiment, all of the values showing in the Experimental Values box should show either bc or 0 (or 1 for sensitivities).
You will also want to check the box to “Include text from this session in Expanded Outputs text fields”
As a reminder, the text fields are: Our Question, Our Hypothesis, Our Findings, Our Decisions. To bring up the text boxes for easy review, click on the Outputs and Text bar. Click to Expand. Click on the layered squares or windows in the upper right corner of the blue bar to make the text box smaller so it’s easy to review the text in the text boxes and main model diagram.
Time Stamp Prioritize tailored team learning Script 00:20-00:25Review the relevant causal system story 2. Practice describing the complexity reveal (causal loop) most relevant to the team’s highest priority need.
6. Study the system diagram and team data, and decide together what change you want to experiment with, that might give the team the desired result.
Click on ____________ under “reveal complexity” to see the systems story relevant to the experiment you decided on in the last session.
In the diagram, the rectangles that look like the levels of gas that you have in your gas tank are showing states in care where patients or appointments can accumulate or drop. For example, in this team we see ___ patients in the ________ stock. The number of patients in a state are influenced by flow rates - designated by circles here that look like speedometers. For example, this ______ rate shows that about ___ patients per week in this team move from _________ to _________ \[show with mouse work\].
Example:
First, explore the Appointments section of the diagram and see how Appointment Supply links to a number of variables.
Then, examine the Patients section and notice how the different gauges and rectangles are linked and what causes them to increase or decrease.
Finally see how the Patients and Appointments interact with each other, for example, by examining appointment supply and return visit interval. Remember, red means values that are read into the model from your team data.
As a team, you decide what change to experiment with in the sim. To make that decision, you should ask: 1) How do we think things will change over time if make a specific change?; and 2) What relationships in the system will interact if we make that change? Ultimately, the team should choose changes that might give the desired result, based on the team vision and team need.
Time Stamp Prioritize tailored team learning Script 00:25-00:35Adjust sliders and set up team’s dynamic hypothesis 3. Practice describing specific value adjustments you expect will be helpful for the team to experiment with related to their highest priority need.
7. To create a new run building off of the previous one, revise the text in all the text boxes to reflect the experiment you want to do now.
Let’s create a new experiment building off of the previous one, the base case of no new decisions. The important thing for learning is to stake a claim about your expectations, so the simulation output can teach you something. This process can also help teams to reconcile differences and achieve consensus about ways to move forward and take action for improvement. You all probably won’t agree about what the likely impact of any change will be, but we can use Modeling to Learn engage in participatory learning to find out.
The first step is to revise the text in all the text boxes to reflect the experiment you want to do now:
 Example Questions and Hypotheses: Briefly describe what your team wants to learn from this experiment and outline the systems story your team believes will cause the outcomes your team expects to observe.
CC
- Q: What will happen to the Starting Rate and New Patient Wait Time if we increase the Appointment Supply of care coordination appointments overall?
- H: Increasing the CC Appointment Supply will make more Appointments available for both new and existing CC patients. The Additional Appointment Supply for New CC Patients will increase the Starting Rate and lower New Patient Wait Times.
MM
- Q: How could we serve more patients with specific conditions, like OUD, with our existing staffing levels?
- H: If our referral rate for OUD is 2 pts per month (0.5 per week), and we allocate 40% of our x-waiver slots to OUD treatment, and 40% to Other Needs, and we change our RVI for depression to 12 weeks, and the RVI for OUD to 4 weeks (in line with our quality standards), then we will serve more OUD patients with our existing team staff, without increasing the wait time for new depression patients.
PSY
- Q: What if we graduate more patients who complete 8 or more psychotherapy sessions in their first 3 months? What is the effect of working to increase the proportion of patients who ‘complete’ an evidence-based dose of PSY and then graduate from just 4% to 75%, over time, on (1) the number of patients who complete and are then ‘done’? and (2) on the supply of available appts for new patients?
- H: We expect that if we increase our completers who graduate to 75%, then we’ll free up more slots in the clinic for more patients to start psychotherapy/EBPsy. We hypothesize that increasing the complete and graduate rate from 4% to 75% will result in a jump from about 4 patients to about 75 patients graduating during the same time period. We also expect that by increasing the graduation rate for any one who has received 8 or more sessions of PSY, we will increase the number of appt slots for new patients starting PSY.
AGG
- Q: How can we manage the loss of two providers and still manage patient needs for PSY? What would happen if we change the PSY RVI to 2 weeks and the RVI for EB PSY to just 1 week (from 17 weeks)?
- H: We expect to see the number of PSY patients in service to go down within the first year, and then to reach a new level that is well below 300. If the numbers were down to 150 patients, then we may be able to handle the staff reduction.
SP
- Q: How much does implementing Measurement Based Care improve our ability to get our high symptom patients into the right care at the right time? How will this change in our team impact the other settings in Mental Health? Will it kick off a virtuous cycle of GMH care quality improving recovery?
- H: If we more readily detect patients’ symptoms and risk, then our improvement rate will increase, moving more patients in to recovery. For this team, with their local resources and constraints, can more patients graduate from general mental health care, our patient load will drop and open more slots to start new care episodes. If we implement measurement based care in our GMH team, then care quality will improve (specifically through reductions in Time to Improve and Time to UnFlag, and an increase in the Time to Ending). Also, how long it takes clinicians to see changes in their patients will also improve (seen in a reduction in Time to Detect). We expect to be able to effectively diagnose and treat patients faster, reducing the number of high-symptom patients in care, and thus reducing the number of patients who receive high risk flags. However, low symptom patients are in care for longer than before, reducing the number of openings for new patients. These patients will make up more and more of our total – as there will be both more flowing in (due to higher Improvement Rate) and fewer flowing out (due to the lower Ending Rate). With fewer openings, wait times to start with our team should increase.
8. Adjust experiment sliders for the new experiment, keeping in mind that the previous run’s settings are in effect (for this session that just means the base case or default values).
Slide the Text box to the left, over the model section. This will allow you to adjust experiment sliders for the new experiment.
In the experiments section we also have experimental sliders with “i” information that tells you what you’re changing when you adjust that slider in your experiment.
Keep in mind that the previous run’s settings are in effect – in this case, we have only run the bc or base case so the default values from the team data are the previous run settings.
A quick tip – make note of the service or services you selected to change and the new values, that is, what you changed the numbers to, so you have that information available for naming the experiment when you save it.
Time Stamp Prioritize tailored team learning Script 00:35-00:40Run experiment
9. Run and then Save (without resetting). Name this run according to the variable setting(s) you changed.
To name the run, click on the down arrow next to Variable, choose the variable you changed, for example, Appointment Supply or Return Visit Interval. Click Add. This will insert an abbreviation of that variable into the experiment name.
Click on the down arrow next to Service, choose the service you adjusted, for example, Psy, Medication Management or Adjunctive services. Click Add.
Finally, click on the down arrow next to Number, choose the number that represents the new value you used in your experiment.
Click Save (not Save & Reset, just Save). The date will automatically be added to the name of the saved experiment.
Time Stamp Prioritize tailored team learning Script 00:40-00:50Describe findings/decisions and save 4. Practice describing outputs (system behaviors) you’re going to check and discuss as a team in relation to the team’s highest priority need.
10. Compare Experiments to see the difference the between base case and the current experimental run.
Navigate to the Results Dashboard. It is here you can choose up to two prior experiments’ results to compare with the current run. Select your base case run.
There are six charts in the dashboard at a time. To see the default set of charts for a specific service, cohort, or setting, go to the main model diagram Experiment Timeline box and under “Display Patient Services” click on the service, cohort, or setting for the specific charts you want to review. First, let’s look at _______ chart, in the _________ section of the screen, as it answers our question _________ .
To see charts of other variables, click on the down arrows under any chart to bring up a list of all variables.
Examine the differences between the base case and the current experimental run. How do these results compare against your hypothesis?
As you describe the findings, record what you observe and learn in the Our Findings text box:
___Example of chart review for SP:___
In our last session, based on the team’s needs assessment, we focused on the team’s issue with long wait times stepping patients up from GMH to SMH when needed. In the bottom middle panel we can see that implementing MBC in our GMH team is likely to reduce the wait Time to Step up to SMH from approximately 45 weeks to 32 weeks over the next two years. I’ll use my mouse and click the down arrow to show you the full variable name, which is highlighted in blue. This reduction in wait times for stepping patients up to Specialty Mental Health is due to the reduction in high symptom patients over the next two years.
We can see this by looking at the upper middle and upper right panels, which show how implementing MBC will improve GMH care quality: As the improvement rate increases, the ratio of high to low symptom patient decreases, fewer patients receive a high risk flag and wait times to step up to SMH decrease.
However, looking at the graph in the upper left corner, patient load stays the same in our MBC experiment as it was in the base case – something prevents our virtuous cycle. The virtuous cycle of our reinforcing feedback, “Higher care quality improves recovery,” depends on the team getting patients better and moving them on from GMH.
As result of our experiment, although wait times to step up form GMH to SMH go down, the lower left and right graphs show that wait times to step down to PC/PCMHI increase, and GMH patients waiting to start increases over the next two years.
To summarize, yes, more of our patients are stabilizing and able to be stepped down to PC. But, we aren’t stepping them all down to PC because PC hasn’t made any new decisions in this experiment and hasn’t implemented any strategies to take on our patients. This causes longer wait times to step GMH patients down, which further reduces the number of patients the GMH team will recommend should step down for care. As we can see in the bottom left graph, the black line for our current MBC experiment shows that improvements in GMH quality due to implementing Measurement Based Care without coordinating this change with primary care will lead to increased wait-times for stepped down, and lead to the undesirable effect of patients waiting to start care in GMH as our stabilized patients build up in our GMH clinic.
Thus, low symptom patients build up in our clinics. Also, PC is taking more patients than they can handle, so their quality declines, and GMH gets more patients stepping up from PC –> demand for GMH goes up! Something that we think is outside of our control is actually a result of our own decision.
 Example Findings: Describe your team’s findings, insights and conclusions from this experiment.
CC - Increasing the supply of Appointment Supply for New CC Patients does increase the new CC patient weekly Starting Rate, which reduces new CC patients Waiting to Start.
MM - We found that if we allocate 50% of our x-waiver provider appointments to OUD, in the long run instead of only starting ½ patient per week (1 every other week), we can start 3 patients in OUD per week. But dropping the appointment supply for our Other patients meant we could not start any of them in care for a while until some existing patients completed and moved on. A backlog built up, which caused referrals to slow. When we were eventually able to start Other patients, the backlog dropped so referrals picked up again, and we established a new steady state with about 15 Other diagnosis patients waiting to start and about 170 in care.
PSY - We found that the total number of patients served by the team increased from N=371 to N=460. Of the 460, n=358 were Initiators and n=132 were Completers. Among Completers, n=99 graduated and were done (75%, as we expected). Regarding the starting rate for new patients, it increased from about 3.8 pts/wk to about 4.8 pts/wk. our hypotheses was supported. This dramatically increases the number of patients in PSY who are receiving an evidence base dose of therapy and supports the team in taking on more new patients, about one more new pt/wk (or 4 new ones per month, or 48 new ones annually!).
AGG - Our hypothesis was supported! We see that implementing a much shorter RVI for PSY patients show a steady reduction in the number of PSY patients in service, from more than 300 in our bc to less than a 100 after two years. Booking rates for PSY climb initially, but then drop off and level out just a bit higher than baseline! One concern is that MM patients in service also drops from about 1000 to 900.
SP - As predicted, we see a dramatic shift in patient from “high symptom” to “low symptom,” as both detection and care quality improve – the ratio of high to low symptom patients drops from 0.6:1 to 0.2:1 over two years. The number of patients with a suicide flag decreases by more than 50%, as more high symptom patients have their symptoms addressed before they can be flagged in the first place. However, the initial predicted reduction in Ending Rate is off-set by long-term increases in the Recommend Step Down Rate, thus not permanently impacting the new patient start rate. Both new patient starts and wait times in our clinic increase in the short-term, but fall below our historical average by 3 months, and continue to fall for the next year. However, because there have been no changes in Primary Care, the number of patients waiting to step down to PC hs increased substantially – from about 110 to 170, who are all undoubtedly waiting significantly longer than before.
11. Discuss and record what changes you may want to make in the clinic and what further experiments you want to run.
Based on what you saw here, and what further experiments you want to run in the Sim.
Type those into the Our Decision text box.
 Example Decisions: Based on what you learned in this experiment, what changes are you ready to make in your practice?
CC - Next time we will experiment with adjusting our Return Visit Interval.
MM - Although we were glad to see that we could care for more OUD patients with our available staffing, we are concerned that if all we do is shift several of our Other appointments to OUD, we won’t be able to help as many Other patients. We decided to experiment with Return to Clinic Visit Intervals as a possible alternate solution.
PSY - For our next experiment, since we have now affirmed that we have additional appt capacity for new (and existing patients), we would like to explore how changing Initiators who Complete from the base case rate of 37% to 75% might impact the number of patients who complete and graduate. This will be the only change we make, so that we can see the effect clearly.
AGG - Now that we have reduced the RVI for PSY and EB PSY, we can look to see what gains in managing our patients may be achieved by rebalancing our service mix. We’ll see what happens if we invest in doing more EB PSY and less PSY, but keeping the proportion of other services more or less as before.
SP - In this experiment, we see a strong connection between changes made in our team and demand and wait times for downstream teams. We should run an experiment that explores these connections, specifically to gauge the impacts of implementing stepped care between GMH and PC/PCMHI.
In an interconnected system, with causal interdependencies over time, simulation can help us find out when our short-term decisions are going to make things worse in the longer term. In the real world, it would be very hard to perceive these longer term system effects, but we can see them using Modeling to Learn and we can evaluate the results against other available decisions to compare their effects and better coordinate Veterans’ care across the team to increase care quality [expand access, or reduce symptoms and risk].
12. Save and Reset when ready.
- Log out of the SIM UI.
That’s it for Modeling to Learn how to test a dynamic hypothesis. Next is our Done/Do review.
Done and Do (15 minutes)
| We ran experiment 1 and compared results against the bc. |
Explore the bc and experiment 1, and draft a dynamic hypothesis to prepare for experiment 2. |
Until next time, thank you for Modeling to Learn!
| Time Stamp | Prioritize tailored team learning | Script |
|---|---|---|
| Success - A successful Done/Do Review is short, specific, simple and shown. |
DO Demo
- Before next time, please explore the base case and experiment results and draft a dynamic hypothesis to prepare for experiment 2.
- To do this, log back into the SIM UI team world.
- In Experiments, select your Experiment 1 run from the list of saved experiments. Click on GO and select the box to include text, to reload your prior QUESTION, HYPOTHESIS, FINDINGS and DECISIONS.
- Expand the OUTPUTS and TEXT section (two clicks!) to reveal all the information saved from the run.
- Copy, paste, and edit your Decisions text to begin developing your new Question and Hypothesis for Experiment 2.
- Save your work (do not Reset) and log off.
5.2.17 Session 08 Say Checklist
Today we’re modeling to learn how to test a dynamic hypothesis.
Hello! I’m __________ and I’m __________ [Co-facilitators introduce themselves]. Today we’re modeling to learn how to test a dynamic hypothesis.
Navigate to the SEE guide to show Done and Do
![]() _____________ Time 00:00-00:05
_____________ Time 00:00-00:05
Done: We logged in to mtl.how/sim and explored the results of the base case (bc) in the Expanded Outputs section to prepare for experiment 1. We reviewed our hypothesis text about the base case ___________________.
-
Do: We will test a dynamic hypothesis about ___________ experiment 1, comparing results against the bc in the MTL sim UI Outputs section.
Emphasize team priority with the learning objectives on the screen
![]() _____________ Time 00:05-00:10
_____________ Time 00:05-00:10
Learning Objectives for Session 8
Describe the systems story your team believes will cause the outcomes you expect to observe in your experiment.
Test your dynamic hypothesis about your team’s clinical priority.
Apply systems thinking to describe your team’s findings, insights, and conclusions from your experiment.
Team lead navigates using Chrome to log in to the Team world at mtl.how/sim****
![]() _____________ Time 00:10-00:15 - Team’s Session 06 Question __________________
_____________ Time 00:10-00:15 - Team’s Session 06 Question __________________
- Join current session to pick up where the team left off in Session 07.
- Orient to “bc” in Experiment Maintenance on the home page: Including ability to rename experiments, if necessary.
- On Main Page team lead navigate to Experiment Section to pull up previous experiment values & text for Session 07 about the Base Case.
Pull up q/h/f/d** from session07 and ask team lead to review team-specific rationale for the Base Case findings
![]() _____________ Time 00:15-00:20** - Team-specific causal system story for findings __________________
_____________ Time 00:15-00:20** - Team-specific causal system story for findings __________________
-
Provide rationale for always comparing simulation experiments against the Base Case of no new decisions.
- Review the “d” decisions text regarding the team consensus about specific values _______________ the team would like to experiment with today.
Bring session 07 “d” decision text to be the question text for experiment 1. Collapse and move Text to right, to use session 07 causal complexity reveal (feedback loop) to revise base case hypothesis for experiment 1.
![]() _____________ Time 00:20-00:25 - Team Priority Causal Loop__________________
_____________ Time 00:20-00:25 - Team Priority Causal Loop__________________
Specific Variables and Values from Priority Causal Loop_______________
- Use the causal system story in the model diagram complexity reveal for the team’s priority to “stake a claim” about what will happen over the next two years in the team if the team’s decisions reflect experiment 1
- Example question: “What happens to ____________ [key output value from the team’s priority], over the next two years if our team practice decisions follow __________________[experiment 1]?”
Move Text to left and refine/enter specific values for experiment 1 in hypothesis text as you adjust sliders
![]() _____________ Time 00:25-00:35 - Team Priority__________________
_____________ Time 00:25-00:35 - Team Priority__________________
Example experiment 1 hypothesis, using specific variables and values: “If we reduce the engagement duration to 12 or 14 weeks in our team, then due to the Feedback Loop: Balancing New and Existing Patients, over the next two years, we will ___________.”
Set all other red and green experiment sliders to “bc” or “zero” except purple sensitivity sliders, which start with a default middle value of “1”.
Run experiment 1
![]() _____________ Time 00:35-00:40 - Team Priority__________________
_____________ Time 00:35-00:40 - Team Priority__________________
- Hit the Green Run Button!
- Go to the Expanded Outputs section and Save (without resetting) our run.
Compare base case and experiment 1 output charts of the specific variables and values related to the team’s highest priority need ________________[output variable]
![]() _____________ Time 00:40-00:50 - Team Priority__________________
_____________ Time 00:40-00:50 - Team Priority__________________
- Enter team findings text about the results for variables related to their highest priority need?
- Describe how Difference between base case and Experiment System Behavior findings are explained by Causal Loop Complexity Reveal for team’s priority in the Our Findings textbox
- Decisions: Based on what the team learned, what will the team decide to do in clinical practice (if anything) and/or:
- Decisions: What specific variables at what specific experiment values will the team use Modeling to Learn to learn next?
Have Team Lead pull up the session 08 SEE guide Done/Do review.
![]() _____________ Time 00:50-00:55
_____________ Time 00:50-00:55
- Done: We ran experiment 1 and compared results against the bc, and entered our Question, Hypothesis, Findings and Decision for Experiment 1 in the Text section.
- Do: Log into mtl.how/sim and Explore the bc and experiment 1, and draft a dynamic hypothesis to prepare for experiment 2.
- Demo for team how to reload team’s prior Question, Hypothesis, Findings and Decision text.
- Reminder to click “Save” and log out.
5.2.18 Session 09 Say Guide

Note: If you are a self-directed learner, then some of the details in the guides may not apply to you. These guides were developed for facilitated Modeling to Learn Live team meetings.
MTL Live Session 09
Today we’re modeling to learn how to compare alternatives.
Done and Do (15 minutes)
| ![]() Done |
Done | ![]() Do |
| — | — |
| We explored the Base Case (bc) and experiment 1 and drafted a dynamic hypothesis to prepare for experiment 2.
Do |
| — | — |
| We explored the Base Case (bc) and experiment 1 and drafted a dynamic hypothesis to prepare for experiment 2.  MTL 2.0. For MTL 1.7, click here | We will run experiment 2 to compare alternatives.
![]()
Learning Objectives
Describe the systems story your team believes will cause the outcomes you expect to observe in your experiment.
Test your dynamic hypothesis about your team’s clinical priority.
Apply systems thinking to describe your team’s findings, insights and conclusions from your experiment.
In-session Exercise (30 minutes)
Running an Experiment
- Log in to your individual or team world at mtl.how/sim.
MTL 2.0. For MTL 1.7, click here
Review your saved runs. Rename your saved runs if you feel you need to.
- If you logged into your individual world, review your saved runs in the Experiment Maintenance section.
Review the data files you have uploaded for use and make sure you have what you want.
- If you logged into your individual world, review the data files you have uploaded in the Team Data Menu Maintenance section.
You can Join Current Session or Start a New Session in the Aggregate module. If you Start a New Session select the team data file you’d like to use.
To refresh your memory and pick up where you left off last time, Select the experiment from the last session and check the box to include text from this session in Expanded Outputs text fields. Review those text fields.

MTL 2.0. For MTL 1.7, click here
Study the systems story on the model diagram and team data, and decide together what change you want to experiment with, that might give you the desired result.
To create a new run building off of the previous one, revise the text in all the text boxes to reflect the experiment you want to do now:
Experiment 2
![]() Our Question. Briefly describe what your team wants to learn from this experiment.
Our Question. Briefly describe what your team wants to learn from this experiment.
![]() Our Hypothesis. Outline the systems story your team believes will cause the outcomes your team expects to observe.
Our Hypothesis. Outline the systems story your team believes will cause the outcomes your team expects to observe.
- Adjust experiment sliders for the new experiment, keeping in mind that the previous run’s settings are in effect.
MTL 2.0. For MTL 1.7, click here
- Run and then Save (without resetting). Name this run according to the variable setting(s) you changed.
MTL 2.0. For MTL 1.7, click here
- Compare Runs to see the difference the between base case and the current experimental run.
MTL 2.0. For MTL 1.7, click here
Record what you learned:
![]() Our Findings. Describe your team’s findings, insights and conclusions from this experiment.
Our Findings. Describe your team’s findings, insights and conclusions from this experiment.
- Discuss and record what changes you may want to make in the clinic and what further experiments you want to run.
![]() Our Decisions. Based on what you learned in this experiment, what changes are you ready to make in your practice?
Our Decisions. Based on what you learned in this experiment, what changes are you ready to make in your practice?
- Save and Reset when ready.
Done and Do (15 minutes)
| ![]() Done |
Done | ![]() Do |
| — | — |
| We ran experiment 2 and used the Control Panel of the Outputs and Text Section to compare bc, exp1, and exp2. MTL 2.0. For MTL 1.7, click here | Run a third experiment in our individual world. |
Do |
| — | — |
| We ran experiment 2 and used the Control Panel of the Outputs and Text Section to compare bc, exp1, and exp2. MTL 2.0. For MTL 1.7, click here | Run a third experiment in our individual world. |
5.2.19 Session 09 Say Checklist
Today we’re modeling to learn how to compare alternatives.
Hello! I’m __________ and I’m __________ [Co-facilitators introduce themselves]. Today we’re modeling to learn how to compare alternatives.
Navigate to the SEE guide to show Done and Do
![]() _____________ Time 00:00-00:05
_____________ Time 00:00-00:05
-
Done: We explored the base case (bc) and experiment 1 and drafted a dynamic hypothesis to prepare for experiment 2.
-
Do: We will run experiment 2 to compare alternatives.
Emphasize team priority with the learning objectives on the screen
![]() _____________ Time 00:05-00:10
_____________ Time 00:05-00:10
Learning Objectives for Session 9
Describe the systems story your team believes will cause the outcomes you expect to observe in your experiment.
Test your dynamic hypothesis about your team’s clinical priority.
Apply systems thinking to describe your team’s findings, insights and conclusions from your experiment.
Team lead navigates using Chrome to log in to the Team world at mtl.how/sim****
![]() _____________ Time 00:10-00:15 - Team’s Session 06 Question __________________
_____________ Time 00:10-00:15 - Team’s Session 06 Question __________________
- Join current session to pick up where the team left off in Session 08.
- On Main Page team lead navigate to Experiment Section to pull up previous experiment values & text for Sessions 07 and 08 to review Experiment 1 as compared to the base case.
Pull up q/h/f/d from session08 and ask team lead to review the rationale for the Experiment 1 findings from the “Findings” Text
![]() _____________ Time 00:15-00:20 - Team-specific causal system story for findings __________________
_____________ Time 00:15-00:20 - Team-specific causal system story for findings __________________
- Provide rationale for always comparing simulation experiments against the base case of no new decisions.
Review the “d” decisions text regarding the team consensus about specific values _______________ the team would like to experiment with today.
Bring session 08 “d” decision text to be the question text for experiment 2. Collapse and move Text to right, to use session 07 and session 08 causal complexity reveal (feedback loop) to revise base case hypothesis for experiment 2. _____________ Time 00:20-00:25 - Team Priority Causal Loop__________________
Specific Variables and Values from Priority Causal Loop_______________Use the causal system story in the model diagram complexity reveal for the team’s priority to “stake a claim” about what will happen over the next two years - relative to the base case and Experiment 1 - if the team’s decisions reflect experiment 2
Example question: “What happens to ____________ [key output value from the team’s priority], over the next two years if our team practice decisions follow __________________[experiment 2]?”
Move Text to left and refine/enter specific values for experiment 2 in hypothesis text as you adjust sliders
![]() _____________ Time 00:25-00:35 - Team Priority__________________
_____________ Time 00:25-00:35 - Team Priority__________________
- Example experiment 2 hypothesis, using specific variables and values: “Relative to the base case and Experiment 1, if we reduce the engagement duration to 12 or 14 weeks in our team, then due to the Feedback Loop: Balancing New and Existing Patients, over the next two years, we will ___________.”
- Set all other red and green experiment sliders to “bc” or “zero” except purple sensitivity sliders, which start with a default middle value of “1”.
Run experiment 2
![]() _____________ Time 00:35-00:40 - Team Priority__________________
_____________ Time 00:35-00:40 - Team Priority__________________
- Hit the Green Run Button!
- Go to the Expanded Outputs section and Save (without resetting) our run.
Compare experiment 2 against base case and experiment 1 output charts of the specific variables and values related to the team’s highest priority need ________________[output variable]
![]() _____________ Time 00:40-00:50 - Team Priority__________________
_____________ Time 00:40-00:50 - Team Priority__________________
- Enter team findings text about the results for variables related to their highest priority need?
- Describe how Differences between base case and experiment 1 and 2 System Behavior findings are explained by Causal Loop Complexity Reveal for team’s priority in the Our Findings textbox
- Decisions: Based on what the team learned, what will the team decide to do in clinical practice (if anything) and/or:
- Decisions: What specific variables at what specific experiment values will the team use Modeling to Learn to learn next?
Have Team Lead pull up the session 09 SEE guide Done/Do review.
![]() _____________ Time 00:50-00:55
_____________ Time 00:50-00:55
- Done: We ran experiment 2 and compared results against the bc and experiment 1, and entered our Question, Hypothesis, Findings and Decision for Experiment 2 in the Text section.
- Do: Log into mtl.how/sim and prepare for experiment 3, by entering q/h/f/d text and running an Experiment 3 that combines Experiments 1 and 2.
- Demo for team how to reload team Question, Hypothesis, Findings and Decision text into Individual World.
- Reminder to click “Save” and log out.
5.2.20 Session 10 Say Guide

MTL Live Session 10
Today we’re modeling to learn how to use systems thinking.
Hello! I’m ________________ (facilitator’s name) and I’m _______________ (co-facilitator’s name). Today we’re modeling to learn how to use systems thinking.
As you can see in the Done/Do table in the Learner See Guide:
Done and Do (15 minutes)
| We ran a third experiment in our individual world. |
We will run exp 3 and discuss the bc, exp 1, exp 2 and exp 3 using Complex, Feedback, Behavior, Time (CFBT) systems thinking skills. |
After this session, you’ll be able to:
![]()
Learning Objectives
- Describe the decisions you experimented with and how they are intertwined with other decisions and clinic outcomes over time.
- Test your understanding of the causal system story by describing what’s happening when it produces a system behavior over time.
- Apply your thinking to anticipate the short and long term trends in your team’s care quality under different decision scenarios.
Let’s get started!
In-session Exercise (30 minutes)
We’ve been Modeling to Learn how to improve our use of systems thinking when making care decisions in our team.
| Systems Thinking | Definition |
|---|---|
| Complex | Forest not trees. Relationships among two or more variables (wait times, improvement rate), or two or more settings (primary care, general mental health). |
| Feedback | Loop not line. Not simple cause and effect. The end of the story often influences the beginning, and is strengthened (reinforcing) or reduced (balancing) around the loop. |
| System Behavior | Movie not snapshot. Trends over time. Systems cause their own behavior through feedback. |
| Time | Short and long term. Better understanding of change over time (e.g., worse before better, better before worse). |
We’ll work to apply these skills as we review our combined experiment 3 today.
1. Log in to mtl.how/sim and join the current session.
2. From the experiment section, pull up the prior experiment and click the red “Go” button.
3. Check the box to include the text from that experiment and click “Go” again.
4. Note that the sliders have moved to the settings for that experiment.
- The experiment sliders automatically adjust to the prior experiment we just selected.
5. Open the Outputs and Text section and select another earlier experiment to compare to the one you have just pulled up.
- Select the two previous experiments, base case from Session 7 and experiment 1 from Session 8, to compare.
6. Note the variables that were manipulated in the two experiments.
7. Review the findings from the two experiments in the results dashboard and the text entered for Hypothesis, Findings and Decisions.
8. Collapse the Outputs and Text section and move it to the side to reveal the causal system model diagram.
9. Use the diagram to tell a causal systems story about the differences in the two experiments.
![]() Our Question. Briefly describe what your team wants to learn from this experiment.
Our Question. Briefly describe what your team wants to learn from this experiment.
10. Consider running a combination experiment that incorporates the sliders manipulated in both experiments.
- Consider running a combination experiment that incorporates the sliders manipulated in both experiments. Enter your Question for this experiment in the Text box.
![]() Our Hypothesis. Outline the systems story your team believes will cause the outcomes your team expects to observe.
Our Hypothesis. Outline the systems story your team believes will cause the outcomes your team expects to observe.
11. Replace text in the Q/H/F/D boxes to reflect the team’s hypotheses and expectations for the combined experiment.
- Use the model diagram to develop a Dynamic Hypothesis about the expected system behaviors that the combined decisions in Experiment 3 will produce. Enter your Hypothesis and delete prior Findings and Decisions.
- Ask, “What do you think the effects will be of these changes? How much better will things get?” Push the team to be as specific as possible, both with their change and the result.
12. Save, name, and run the combined experiment.
- Move the text to the left to adjust the experiment sliders to reflect the desired Experiment 3, then save, name, and run the experiment.
13. Discuss and record results and decisions, including your thinking about long-term trends in your clinic’s EBP reach under various decision scenarios.
- In the Results Dashboard, review how causal feedback explains why the decisions in experiment 3 combine to produce the relative differences in specific variables and values over time. Enter your Findings about causal relationships that explain the differences in short- and long-term trends between the base case, experiment 1, experiment 2, and experiment 3. Document decisions the team will consider implementing in the clinic.
- Model systems thinking for the team by highlighting the C.F.B.T. systems thinking concepts that are included in the q/h/f/d text boxes.
- Note the dominant causal feedback that produces the system behaviors, and note the highest leverage (high yield) decisions that are most clinically feasible for the team to implement in their care.
That’s it for Modeling to Learn how to use systems thinking. Next is our Done/Do review.
Done and Do (15 minutes)
| We ran exp 3 and discussed the results using systems thinking skills. |
Review and compare the bc, exp 1, exp 2 and exp 3 and think about possible new decisions team could make in their daily clinical care. |
Until next time, thank you for Modeling to Learn!
5.2.21 Session 10 Say Checklist
Today we’re modeling to learn how to use systems thinking.
Hello! I’m __________ and I’m __________ [Co-facilitators introduce themselves].
Navigate to the SEE guide to show Done and Do
![]() _____________ Time 00:00-00:05
_____________ Time 00:00-00:05
-
Done We ran a third experiment in our individual world.
-
Do We will run exp 3 and discuss the bc, exp 1, exp 2 and exp 3 using Complex, Feedback, Behavior, Time (CFBT) systems thinking skills. |
Emphasize team priority with the learning objectives on the screen
![]() _____________ Time 00:05-00:10
_____________ Time 00:05-00:10
-
Learning Objectives for Session 10
Describe the decisions you experimented with and how they are intertwined with other decisions and clinic outcomes over time.
Test your understanding of the causal system story by describing what’s happening when it produces a system behavior over time.
Apply your thinking to anticipate the short and long term trends in your team’s care quality under different decision scenarios.
Facilitator provides rationale: We’ve been Modeling to Learn how to improve our use of systems thinking when making care decisions in our team.
![]() _____________ Time 00:10-00:15
_____________ Time 00:10-00:15
- Show the Systems Thinking Table in the SEE guide.
| Systems Thinking | Definition |
|---|---|
| Complex | Forest not trees. Relationships among two or more units (patients, weeks), variables (stocks: patients waiting to start, flows: improvement rate), or two or more settings (primary care, general mental health). |
| Feedback | Loop not line. Not simple cause and effect. The end of the story often influences the beginning, and is strengthened (reinforcing) or reduced (balancing) around the loop. |
| System Behavior | Movie not snapshot. Trends over time. Systems cause their own behavior through feedback. |
| Time | Short and long term. Better understanding of change over time (e.g., worse before better, better before worse, better before a lot better, worse before a lot worse). |
Team lead navigates using Chrome to log in to the Team world at mtl.how/sim****
![]() _____________ Time 00:10-00:15 - Team’s Session 06 Question __________________
_____________ Time 00:10-00:15 - Team’s Session 06 Question __________________
- Join current session to pick up where the team left off in Session 09.
- On Main Page team lead navigate to Experiment Section to pull up previous experiment values & text to review Experiment 2, and Experiment 1 as compared to the Base Case.
Pull up q/h/f/d from session 09 and ask team lead to review the rationale for the relative differences among Experiment 2, Experiment 1, and the Base Case findings from the “Findings” Text
![]() _____________ Time 00:15-00:20 - Team-specific causal system story for findings __________________
If you did not reset the Team World at the end of Session 9:
_____________ Time 00:15-00:20 - Team-specific causal system story for findings __________________
If you did not reset the Team World at the end of Session 9:
- Log in to mtl.how/sim and join the current session, which should be at the end of the Experiment 2.
The advantage of starting session 10 at the end of the Experiment 2 run in the Team World, is that you can compare the system behaviors of Experiment 2 (the current run) against both the Base Case (alternative 1) and Experiment 1 (alternative 2).
Review how the causal feedback explains why the simulated team practice decisions** produce the specific variables and values produced in the system behaviors over time.
![]() _____________ Time 00:20-00:25 - Team Priority Causal Loop**__________________
_____________ Time 00:20-00:25 - Team Priority Causal Loop**__________________
-
Minimize Outputs and Text and move the text to the Right to reveal the causal system diagram.
- Refine/edit Experiment 2 text to capture the causal explanations for the differences between the Base Case, Experiment 1 and Experiment 2 entered for Hypothesis, Findings and Decisions.
Paste the Decision Text in the Question Box for Experiment 3.
![]() _____________ Time 00:25-00:30
_____________ Time 00:25-00:30
- Refine the text as necessary to reflect today’s learning goal to combine the team decisions reflected in Experiment 1 and 2.
Use then causal system story in the model diagram to craft a Dynamic Hypothesis
![]() _____________ Time 00:30-00:35
_____________ Time 00:30-00:35
- Use the causal system story in the model diagram complexity reveal for the team’s priority that explains the expected system behaviors that will be produced under the combined decisions reflected in Experiment 3.
- Example question: “As compared to the Base Case, Experiment 1 and Experiment 2, what happens to ____________ [key output value from the team’s priority], over the next two years if our team practice decisions follow __________________[combined experiment 3]?”
Move Text to left and refine/enter specific values for experiment 3 in hypothesis text as you adjust sliders and run experiment 3
![]() _____________ Time 00:35-00:40 - Team Priority__________________
_____________ Time 00:35-00:40 - Team Priority__________________
- **Specific variables and values for combined experiment 3 _______________
- Set all other red and green experiment sliders to “bc” or “zero” except purple sensitivity sliders, which start with a default middle value of “1”.
- Hit the Green Run Button!
- Go to the Expanded Outputs section and Save (without resetting) our run.
Use Systems Thinking to explain Combined Experiment 3 as compared to Base Case and Experiments 1 and 2 output charts of the specific variables and values related to the team’s highest priority need ________________[output variable]
![]() _____________ Time 00:40-00:50 - Team Priority__________________
_____________ Time 00:40-00:50 - Team Priority__________________
Results Dashboard review how the causal feedback explains why the combined team practice decisions produce the relative differences in specific variables and values produced in the system behaviors over time.
Model for the team, and highlight the C.F.B.T. systems thinking concepts and add explanations in q/h/f/d text boxes.
Dominant causal feedback that produces the system behaviors _______________
Highest leverage (high yield) decisions that are most clinically feasible for the team to implement in their care _______________
Enter Decisions Text to reflect new practice decisions the team would like to consider next and then click Save to save the text edits for Experiment 3.
Have Team Lead pull up the session 10 SEE guide Done/Do review.
![]() _____________ Time 00:50-00:55
_____________ Time 00:50-00:55
- Done: We ran exp 3 and discussed the results using C.F.B.T. systems thinking skills.
- Do: Review and compare the bc, exp 1, exp 2 and exp 3 and think about possible new decisions team could make in their daily clinical care.
5.2.22 Session 11 Say Guide

MTL Live Session 11
Today we’re modeling to learn how to make future team decisions.
Hello! I’m ________________ (facilitator’s name) and I’m _______________ (co-facilitator’s name). Today we’re modeling to learn how to make future team decisions.
As you can see in the Done/Do table in the Learner See Guide:
Done and Do (15 minutes)
| We thought about possible decisions or changes the team could make in clinical care based on our comparison of the bc, exp 1, exp 2 and exp 3 in mtl.how/sim. |
We will discuss the team’s learning using C.F.B.T. systems thinking skills and prioritize ways to implement new practice decisions in our clinical care. |
After this session you will be able to:
![]()
Learning Objectives
- Describe what your team has prioritized as decisions to implement in your clinic.
- Test your team’s plan against your individual and shared team vision.
- Apply your team’s plan in clinical decisions using C.F.B.T. systems thinking.
Let’s get started
In-session Exercise (30 minutes): Pulling together team learnings, decisions, and vision
Connect learning and decisions from experiments to original team vision, question, and need
1. What shared vision did the team decide on in session 1?
- Throughout Modeling to Learn, we’ve made lots of team decisions. Let’s review them and see what they mean for future decisions. What shared vision for Modeling to Learn did the team decide on in Session 1? We’ve tied our experiments and decisions throughout MTL to that vision.
2. What team need and questions did we identify?
- In sessions 2 and 3 we explored team data and trends using the MTL data UI. We learned how to find an individual patient, how to visualize trends over time for our own care or the teams’ as a whole. And we built our team data file for use in the sim. In session 4 we completed the MTL Menu to prioritize our team’s need. What questions did we identify and study over the next 5 sessions, using the sim UI to better understand the causal systems story of our team’s need over time?
3. What hypotheses did we test?
4. What insights will we keep in mind as we make clinic decisions?
- Let’s discuss what our Findings and Decisions mean for the team going forward. As we discuss new individual and team practice decisions keep in mind the systems thinking rationale for why a practice decision would lead to desired outcomes over time. As we discuss these questions consider Complexity, Feedback, and System Behavior over Time. What insights will we keep in mind as we make future clinic decisions?
5. What new approaches or targets do we want to focus on?
- Let’s think about the key insights we’ve gotten about decisions that are within our control.
6. What concrete actions will the team take in the real world?
7. How do these decisions align with the team’s shared vision, question and needs?
8. What data will we watch to see how we’re doing?
That’s it for Modeling to Learn how to make future team decisions. Next is our Done/Do review.
Done and Do (15 minutes)
| We discussed the team’s learning and new individual and team practice decisions that apply C.F.B.T. systems thinking skills in prioritized ways to implement it in our clinical care. |
Reflect on our team’s vision for MTL and our MTL experience to prepare for planning next steps. |
DO demo
- After we complete Modeling to Learn next time, you can still access ALL the MTL resources.
- You can log in to the sim UI and review all the experiments saved in the Team and Individual worlds.
- You can run new experiments in the same module, or in any of the other 4 MTL modules.
- You can log in to the data UI and look at all sorts of team and individual trends.
- And of course, there are many materials and links at mtl.how.
- For next time, as you have time, look back at those resources to refresh your memory, and be thinking about how they might be useful to you after MTL.
Until next time, thank you for Modeling to Learn!
5.2.23 Session 11 Say Checklist
Today we’re modeling to learn how to make future team decisions.
Hello! I’m __________ and I’m __________ [Co-facilitators introduce themselves]. Today we’re modeling to learn how to make future team decisions.
Navigate to the SEE guide to show Done and Do
![]() _____________ Time 00:00-00:05
_____________ Time 00:00-00:05
- Done We thought about possible decisions or changes the team could make in clinical care based on our comparison of the bc, exp 1, exp 2 and exp 3 in mtl.how/sim.
- Do We will discuss the team’s learning using C.F.B.T. systems thinking skills and prioritize ways to implement new practice decisions in our clinical care.|
Emphasize team priority with the learning objectives on the screen
![]() _____________ Time 00:05-00:10
- [ ]
_____________ Time 00:05-00:10
- [ ] ![]()
Learning Objectives for Session 11
- Describe what your team has prioritized as decisions to implement in your clinic.
- Test your team’s plan against your individual and shared, team vision.
- Apply your team’s plan in clinical decisions using C.F.B.T. systems thinking.
Facilitator prepare team-tailored C.F.B.T. rationale for the session 11 discussion: We’ve been Modeling to Learn how to use systems thinking when making care decisions in our team. Prepare your script to model and reflect team decisions using C.F.B.T. systems thinking
| Systems Thinking | Definition |
|---|---|
| Complex _________________ [team example(s)] | Forest not trees. Relationships among two or more units (patients, weeks), variables (stocks: patients waiting to start, flows: improvement rate), or two or more settings (primary care, general mental health). |
| Feedback _________________ [team example(s)] | Loop not line. Not simple cause and effect. The end of the story often influences the beginning, and is strengthened (reinforcing) or reduced (balancing) around the loop. |
| System Behavior _________________ [team example(s)] | Movie not snapshot. Trends over time. Systems cause their own behavior through feedback. |
| Time _________________ [team example(s)] | Short and long term. Better understanding of change over time (e.g., worse before better, better before worse, better before a lot better, worse before a lot worse). |
![]() _____________ Time 00:10-00:20
_____________ Time 00:10-00:20
1. We’ve made lots of team decisions, including selecting ______________ as team lead.
2. Shared vision for Modeling to Learn _______________
3. In sessions 2 and 3 we found key team trends _______________
4. In session 4 we used the MTL Menu and identified our highest priority team need now __________________
5. In sessions 5 through 10 we learned to tell a causal system story of our team’s need using the __________________ causal feedback.
New individual and team practice decisions that apply C.F.B.T. systems thinking skills:
___________________ [exp 1]
___________________ [exp 2]
___________________ [exp 3]
Discuss new individual and team practice decisions using C.F.B.T. systems thinking rationale for why a practice decision would lead to desired outcomes over time.
![]() _____________ Time 00:20-00:50**
_____________ Time 00:20-00:50**
- What shared vision did the team decide on in session 1?
- What team need and questions did we identify?
- What hypotheses did we test?
- What insights will we keep in mind as we make clinic decisions?
- What new approaches or targets do we want to focus on?
- What concrete actions can the team take in the real world?
- How do these decisions align with the team’s shared vision, question and needs?
- What data will we watch to see how we’re doing?
Have Team Lead pull up the session 11 SEE guide Done/Do review.
![]() _____________ Time 00:50-00:55
_____________ Time 00:50-00:55
- Done: We discussed the team’s learning and new individual and team practice decisions that apply C.F.B.T. systems thinking skills in prioritized ways to implement it in our clinical care.
- Reflect on our team’s vision for MTL and our MTL experience to prepare for planning next steps.
5.2.24 Session 12 Say Guide

MTL Live Session 12
Today we’re modeling to learn how to turn team learning into a team plan.
Hello! I’m ________________ (facilitator’s name) and I’m _______________ (co-facilitator’s name). Today we’re modeling to learn how to make future team decisions.
Done and Do (15 minutes)
| We discussed the new practice decisions we are prioritizing across our team. | Reflect on our MTL participatory learning and finalize our team plan for next steps. |
![]()
Learning Objectives
- Describe what your team has learned throughout the MTL 12-session program.
- Test out with each other how your new practice decisions based on systems thinking align with your team’s shared vision.
- Apply the new decisions that your team has prioritized.
In-session Exercise: MTL graduation and post-MTL plan (30 minutes)
1. We completed Modeling to Learn! Let’s review and plan!
2. What has the team learned throughout the Modeling to Learn 12-session program?
- MTL Co-Facilitators prepare a brief summary of themes to highlight with the team ____________________
3. How will we coordinate our efforts going forward based on our learning?
How will we align our new practice decisions with systems thinking going forward based on our learning?
MTL Co-Facilitators prepare concise review of causal system story of team problem ____________________
MTL Co-Facilitators prepare concise review of feasible practice decisions to prioritize ____________________
4. What MTL resources will the team use or revisit in the future?
MTL data UI? (What data will be most helpful to check back in on?)
MTL sim UI? (Which module would be most appropriate to your further need and questions?)
5. Lead person(s) and time frame for the above actions: _______________
6. Celebrate completion of Modeling to Learn!
MTL RESOURCES
You will continue to have access to the sim UI at mtl.how/sim. Remember that you can use the sim UI in two ways. You can log in to your individual world and play on your own, or the team can explore together in the team world. Let’s review the special features of each of the 5 modules and what kinds of needs they can help you think through.
In Care Coordination (CC), you can compare multiple experiments and look at things like how Overwork Affects No-Shows and how you Balance New and Existing Patients.
In Medication Management (MM) you can experiment with team decisions across different diagnostic cohorts and how best to allocate appointments for your providers with and without x-waivers.
In Psychotherapy (PSY), you can look at different patterns of engagement that patients may follow. In the team data table for PSY, you can pull up charts to see a profile of the team’s historical patient engagement pattern; and in the Outputs section you can look at the Sankey diagram to compare patient engagement patterns and the associated appointment usage for different experiments.
In the Aggregate (AGG) module, you can test hypotheses about your overall mix of services. The unique feature here is that in Outputs, you can choose to compare either different experiments (as you can in all the modules), or you can compare the effects of a given experiment across the different services.
The Measurement Based Stepped Care and Suicide Prevention(SP) module allows you to run experiments involving multiple mental health care settings, to see how decisions made in one setting impact patient care and wait times across the continuum of care.
Another resource is the library of MTL videos, available at mtl.how/video. For sessions 5 through 10 which involve simulation, there are recordings not just for the module your team decided to use, but for all 5. Like Modeling to Learn Live, MTL Videos are accredited through TMS for continuing education credits.
Finally, you can join the Modeling to Learn Listserv at mtl.how@va.gov; and you can always email questions for MTL staff to mtl.help@va.gov.
Now let’s make a plan for how the team will keep modeling to learn going forward.
- How could you, as a clinician, or the team as a whole, see using these resources to continue quality improvement through team decision-making?
- Is there another big question you’d like to explore through simulated experiments - either in the same module or a different one?
- Could it be helpful to refer back the model diagram as a reminder of the systems stories it tells about decisions you make as a team?
- Do you want to set aside some specific times - a portion of a meeting every week, or month, or quarter, say, to further explore your data and test your hypotheses?
- How might you share these resources with new team members, and give them a dose of systems thinking?
- Is there anyone who’d like to keep up their MTL skills and be a local MTL champion or coach, to remind the team of MTL when a new challenge appears on the horizon?
- Some teams ask for a “booster” session after a few months. We’re happy to facilitate that as well.
It’s great if you make a concrete action plan, identify a point person, and call on us as needed.
Congratulations on completing Modeling to Learn! Here is our final Done/Do Review.
Done and Do (15 minutes)
| We completed Modeling to Learn! |  Follow team plan for next steps. Visit mtl.how for ongoing release updates and assistance using MTL resources. Follow team plan for next steps. Visit mtl.how for ongoing release updates and assistance using MTL resources. |
5.2.25 Session 12 Say Checklist
Today we’re modeling to learn how to turn team learning into a team plan.
Hello! I’m __________ and I’m __________ [Co-facilitators introduce themselves]. Today we’re modeling to learn how to turn team learning into a team plan.
Navigate to the SEE guide to show Done and Do
![]() _____________ Time 00:00-00:05
_____________ Time 00:00-00:05
- Done We reflected on our team’s vision for MTL and our MTL experience to prepare for planning next steps.
- Do Reflect together on our team’s vision and MTL experience and make a team plan for next steps.
Emphasize team priority with the learning objectives on the screen
![]() _____________ Time 00:05-00:10
- [ ]
_____________ Time 00:05-00:10
- [ ] ![]()
Learning Objectives for Session 12
Describe what your team has learned throughout the MTL 12-session program.
Test out with each other how your new practice decisions based on systems thinking align with your team’s shared vision.
Apply the new decisions that your team has prioritized.
1. We completed Modeling to Learn!
![]() _____________ Time 00:10-00:30
_____________ Time 00:10-00:30
- 2. Brief summary of themes to highlight with the team ____________________
- How will we coordinate our efforts going forward based on our learning?
Concise review of causal system story of team problem ____________________
Concise review of feasible practice decisions to prioritize ____________________
What MTL resources will the team use or revisit in the future?
MTL data UI ___________________
MTL sim UI (Which module would be most appropriate to our further need and questions?) ___________________
Lead person(s) and time frame for the above actions: _______________
6. Celebrate completion of Modeling to Learn!
![]() _____________ Time 00:30-00:50
_____________ Time 00:30-00:50
Have Team Lead pull up the session 12 SEE guide Done/Do review.
![]() _____________ Time 00:50-00:60
_____________ Time 00:50-00:60
- Done: We completed Modeling to Learn!
- Follow team plan for next steps. Visit mtl.how for ongoing release updates and assistance using MTL resources.