Chapter 4 MTL Red

4.1 Learner
4.1.1 Part 01 See Guide
Today we’re modeling to learn from patient data and team trends.
Done and Do (15 minutes)
 We logged in to mtl.how/data to look at the facility data. We logged in to mtl.how/data to look at the facility data.  |
We will build our team in the MTL Data User Interface and review our team data.  |
![]()
Learning Objectives
Describe the decisions your team made in producing your team data table.
Test whether team historical trends shown in the “viz” tabs reflect your expectations.
Apply your clinical expertise to identify new information about a team patient in the “data” tabs.
In-session Exercise (30 minutes)
MTL on BISL
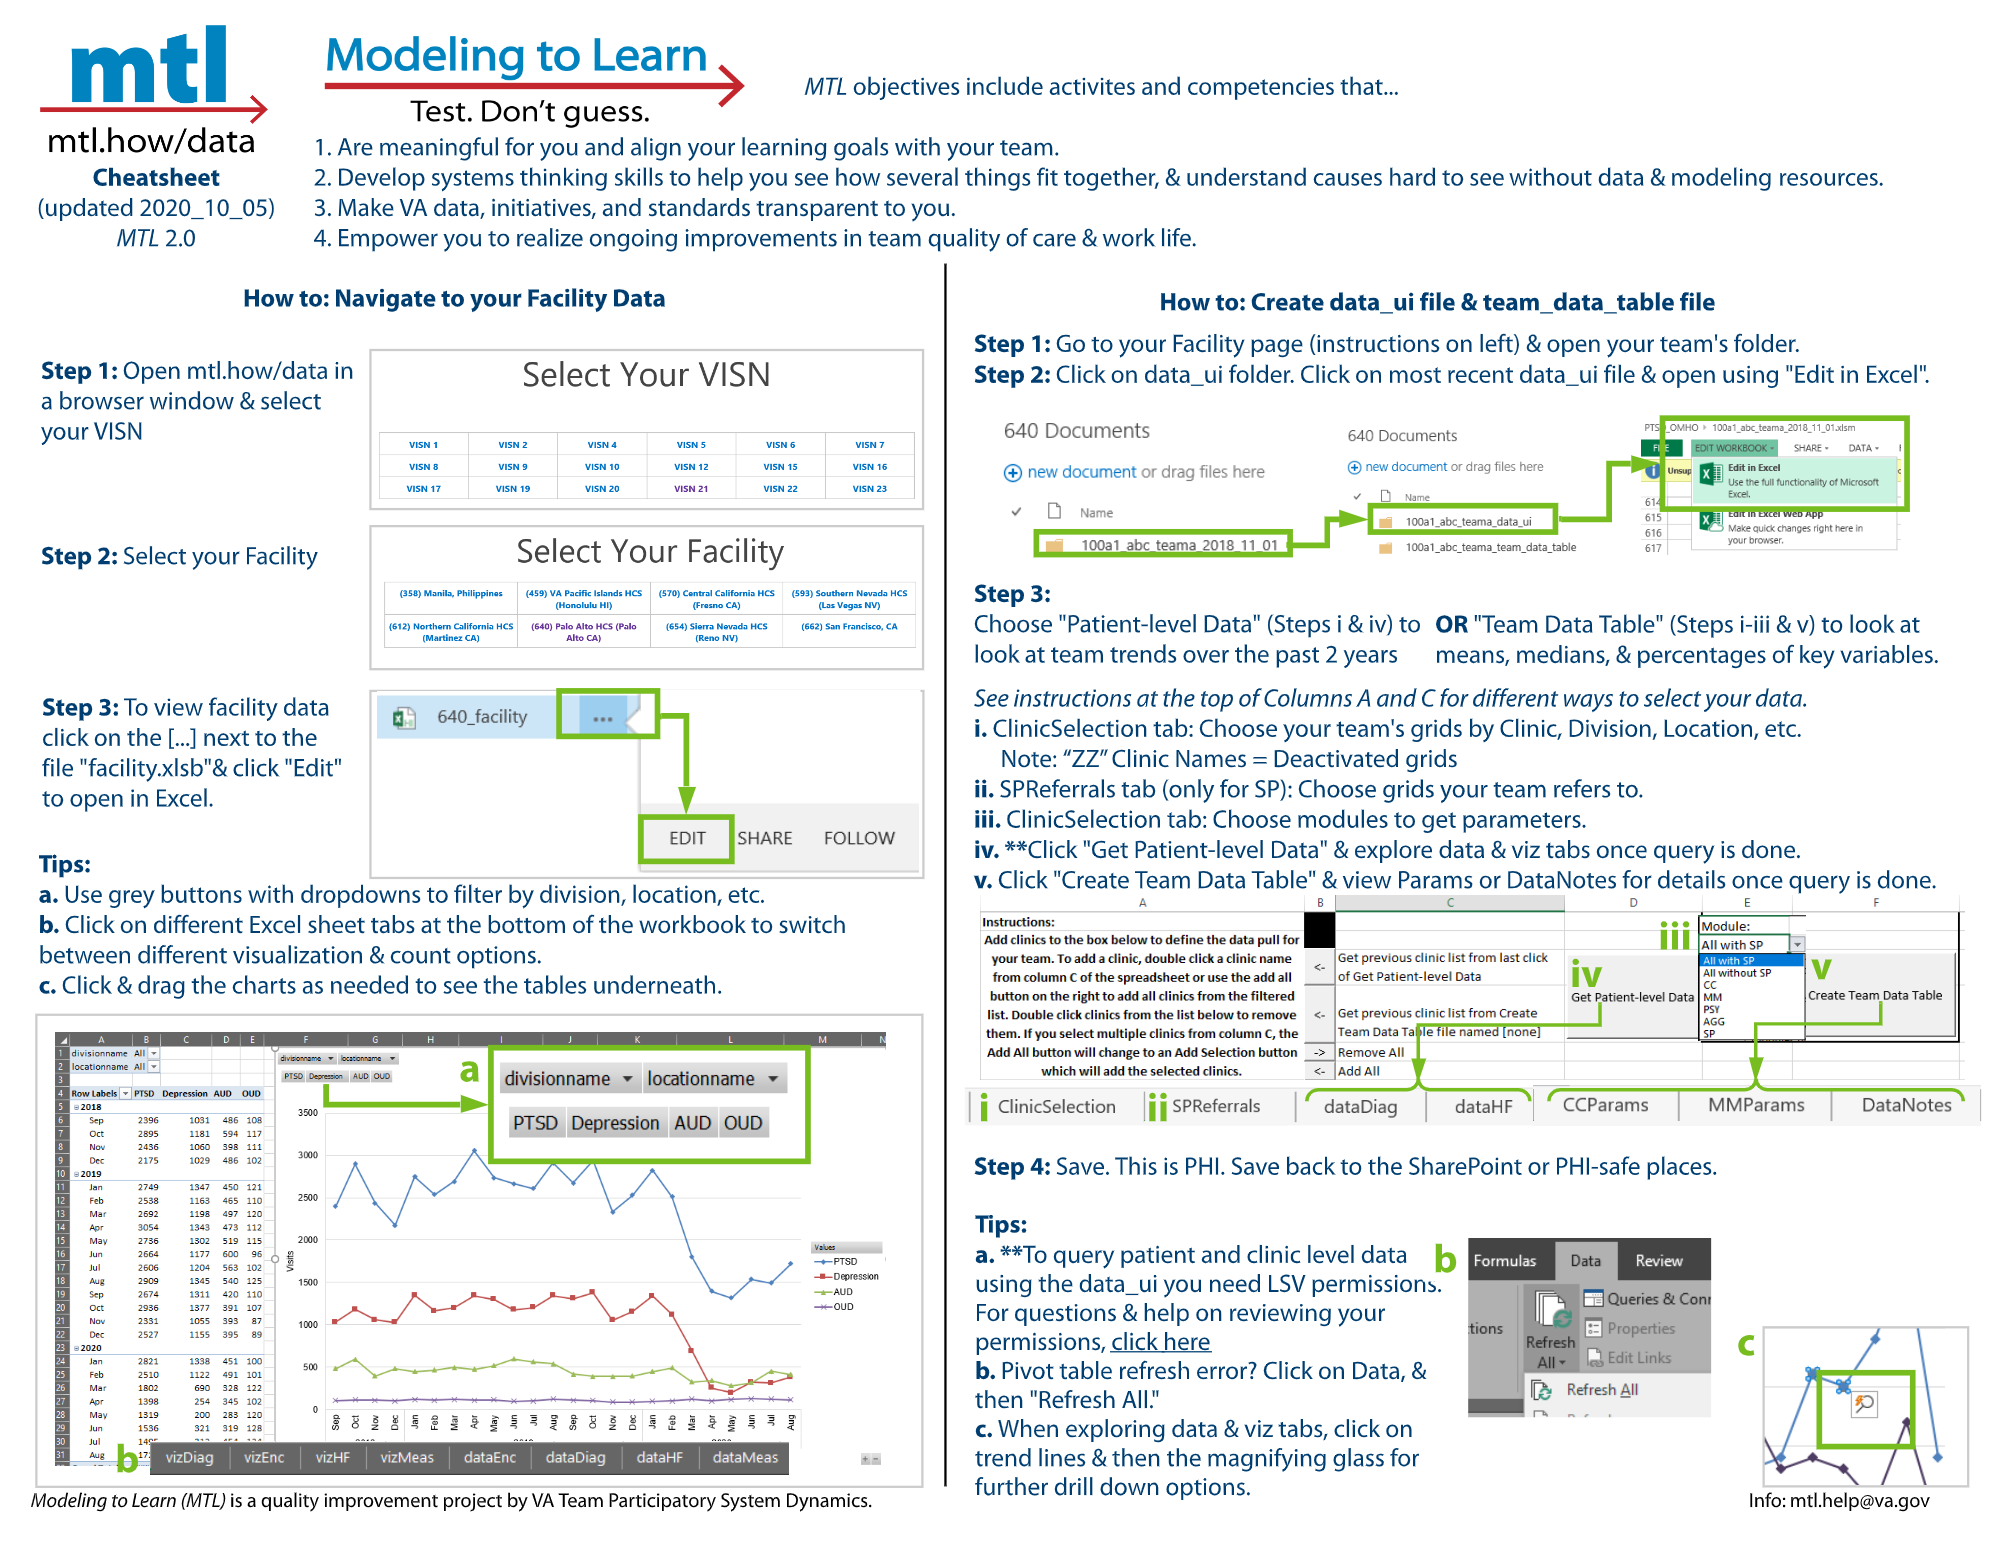
1. Open an internet browser window. Go to mtl.how/data. First select your VISN and then select your facility.

2. Explore the facility data.
- To view facility data click on the […] next to the file “facility.xlsb” and click “Edit” to open in Excel.
- Team files are in team folders. If you do not see a team folder, click on “Request New Team Folder” in the horizontal header next the BISL logo.

- Click through the tabs on the bottom of the Excel spreadsheet. What options are there and what do they mean? Hints:
- Data: Sortable report of data
- Diag: Diagnostic data
- Enc: Encounter types of visits
- HF: Health Factors data related to visits
- Meas: Measures or flag names
- Viz: Visualization of trends
- What filtering options are available?
- Filter to your clinic or division to see trends for the last two years.
- vizDiag shows unique visits by primary diagnosis on the visit of PTSD, Dep, OUD, or AUD.
NOTE: Refresh your data if you are experiencing issues or discrepancies within the data and filtering facilities/clinics.
- To refresh your facility file’s data, right click on any tab at the bottom of the Excel spreadsheet and select “Unhide…”.
- In the “Unhide sheet:” dropdown, select “Control” and click “OK”.
- In the “Control” tab, select your VA facility’s station number in the “Station:” dropdown and click “Refresh”.
- Do not worry if you see your Excel worksheet become unresponsive as the data is refreshing and will take about 1-2 minutes to complete.
- Warning: Do NOT click “Propagate” as this is used by our data team to update facility data across the nation.

Your Team Data Folder
3. Scroll to your team folder at the bottom of the page. Open the data_ui folder and open your data_ui file in Excel.
- Click on the 3 dots [ … ] next to the data_ui file.
- Click on “Edit” to open in Excel, then click “Edit Workbook” at the top of the sheet.

4. Go to the ClinicSelection tab. Use columns C-H to select the clinics that make up your team.
- You can sort and filter by Clinic Name, Division Name, Physical Location, Primary Stopcode, Secondary Stopcode, and Default Provider.
- Note: This will pull all clinics used in the last two years, including de-activated clinics (denoted by a “ZZ” prefix). You can also see the de-activated clinic’s inactivation date in column I.
- Follow the instructions in Box A2.
- After filtering, click the “Add All” arrow in column B (Cell B6). Fine-tune your selections by double-clicking on the clinic name in column A (to remove) or column C (to add).
- In the future, if you want to quickly get the same list of clinics again, you can select the grey “Get previous clinic list from last click of Get Patient-level Data” arrow in Column B (Cell B3).
5. To view your team patient data and your team trends click “Get Patient-level Data.” We will not do this in-session today.
- You already have a fresh data UI file to work with in your team data_ui folder.
- We will learn about the “Create Team Data Table” button in our next team meeting.
- To query patient and clinic level data using the data_ui, you will need LSV permissions. To check which facilities you have LSV access for, click here (VA intranet only).
- If you don’t have access to facilities that you believe you should, please verify:
- CPRS access/permissions at your station (i.e COR tab access for CPRS).
- Your network username recorded in VistA. To have your network username recording in VistA, please follow the instructions outlined here (VA intranet only).
NOTE: It takes some time to run a query from your team data UI to the VA Corporate Data Warehouse.
- On average (depending on the size of your team) it may take 15 minutes or so for your team data UI to pull in fresh data, and Microsoft Excel will be unresponsive until the data UI has finished pulling in your data.

6. Click to view the “viz” tab, which show team trends.
- There are team trends for diagnoses, encounters, health factor data (e.g., suicide plans, evidence-based practice templates), and measures from Mental Health Assistant.
- What stands out to you?
- What is most important to you to check out first?
- What is most surprising?

Click on any trend line and then “Quick Explore” (look for the magnifying glass). In the “Explore” box, pick the item you want to explore and click “Drill To.” Keep using the Quick Explore to drill until you reach the data you want.
- To return to the original settings, click on the gray “Reset Pivot Chart.”
- The viz tabs will also return to default selections, when you click “Get Patient-level Data” for new data pulls.
Right click on a trend line and filter to hide a selected item or only keep the selected item.
vizDiag in the data UI shows a drill down by diagnoses or combination of diagnoses.

- For Veterans Video Connect (VVC), use the VVC filter in the vizEnc tab.

7. Click to view the “data” tab, which show your team’s individual patient information.
Patients who have requested restricted access to their information have asterisks (****) in Column F (dataDiag, dataHF) or Column E (dataMeas). If you are a VA provider, you can still identify patients from Column G (dataDiag, dataHF) or Column F (dataMeas).
Patient information corresponds to the same categories as the team trends: diagnoses, encounters, health factor data (e.g., suicide plans, evidence-based practice templates), and measures from Mental Health Assistant.
Providers can filter to find specific patients, or produce reports.
dataDiag in the data UI has an additional column after “Diagnoses of Interest,” called “Primary Diagnoses”, specifying which diagnosis is primary.

- What data tab would you use to find out how many current patients on the team are engaged in a specific evidence-based psychotherapy? What column shows you the session number (EBP template) that the patient is on?
- What viz option would you use to see what the most common service encounters or visits are?
- Are there services that have been increasing over time? Are there services that have been decreasing over time?
With the team trends (viz) and team patient (data) information in the data UI, your team can efficiently use team meetings to focus on the interrelated issues of care coordination and team quality improvement.
Done and Do (15 minutes)
 We selected the clinics that make up our team for the Team Data UI. We selected the clinics that make up our team for the Team Data UI. |
Review the HF, Diag, Enc and SP tabs in Team Data UI to find a patient (zoom in) and find a team trend (zoom out). Log in to mtl.how/data and look at the two team folders: data_ui and team_data_table. |
4.1.2 Part 02 See Guide
Today we’re modeling to learn how to calculate team parameters.
Done and Do (15 minutes)
| We reviewed the HF, Diag, Enc and SP tabs in Team Data to find a patient and a team trend. We logged in to mtl.how/data and looked at the two team folders: data_ui and team_data_table. |
We will examine calculated team parameters for CC, MM, PSY, AGG, and SP.  |
![]()
Learning Objectives
Describe your team trends over the last two years based on the estimates in the team data table.
Test your understanding of how the team data are estimated by reviewing descriptions and definitions.
Apply your clinical expertise to consider the team trends in the data UI and team data table to identify team priorities for learning.
In-session Exercise (30 minutes)
When you click the “Create Team Data Table” button, it produces a table of descriptive team data.
We will not do this in-session today. You already have a fresh Team Data Table to work with in your team_data_table folder.
Data are means, medians and percentages of key variables likely to influence the team’s priorities for learning from Modeling to Learn
There are team data produced for each module of Modeling to Learn
- Care Coordination (CC)
- Medication Management (MM)
- Psychotherapy (PSY)
- Aggregate team services (AGG)
- Measurement-based stepped care and suicide prevention (SP)
Select a set of clinics in ClinicSelection tab similar to what you did for the data UI.
In the future, if you would like to use the same clinic selections for pulling new parameters, you can select the “Get previous clinic list from Create Team Data Table file” arrow in Column B (Cell B4).
If you want to produce a team data table for the SP module, click on the SPReferrals tab. Use this tab to select clinics that your team refers to/receives referrals from for the Measurement Based Stepped Care and Suicide Prevention module. The data pull will track patients stepped up/down between your team and the one(s) you select. For example, if you are a GMH team, you would select “SMH” in the dropdown for “The clinics selected below that my team refers to are” and add the SMH clinics your team refers to in Column A. Once you have selected referral clinics in the SPReferrals tab, return to the “ClinicSelection” tab.

Click on the module drop-down to select the module you want and select “Create Team Data Table.” You can generate a team data table for each of the modules individually, all the modules without SP (called “All without SP”), or all the modules with SP (called “All with SP”). - When you select a team data table option for specific modules, the team_data_table file you generate will have all five module tabs and labels, but will populate 0s for all other parameters that were not selected.
If you included SP in the module selection, three pop-ups will appear for the three possible care settings (GMH, SMH, PC/PCMHI) to indicate the threshold for minimum gap in patient care required for subsequent visit to be considered a new care episode. In general for the (GMH or SMH or PC/PCMHI) setting, how long of a gap in patient care is required for the subsequent visit to be considered a new care episode? Set the threshold below in weeks. The default threshold is 39 weeks (9 months).

1. Select a module for review
- Find a variable that is important to your team. How is it estimated in this table? What are its units?
- Where can you find even more detailed information about your team data?
- Check out the last two columns. What is the difference between these two columns?
2. Select a second module for review
- Check out the last two columns.
- Find a variable that is important to you team. How is it estimated in this table? What are its units?
- Where can you find even more detailed information about your team data?
3. Are there any team data table values you would like to explore in the team data UI?
- If so, which ones? Open the data UI to examine your question.
4. Does the team see any values in the team data that seem to vary significantly from expectations?
- If so, what is surprising? Does the estimation definition (second to last column, text in red) help you to interpret the variable value?
5. Does the team see any values in the team data that fit your expectations about high priority team needs?
- If so, what are you noticing? In what ways does the team data fit with your day-to-day clinical practice in your team?
Done and Do (15 minutes)
| We examined team parameters for CC, MM, PSY, AGG, and SP. |
Find something in the team data table and consider its implications for team decisions. |
4.2 Facilitator
4.2.1 Part 01 Say Guide
Hello! I’m ______ and I’m ______.
Today we’re modeling to learn from patient data and team trends.
Done and Do (15 minutes)
| We logged in to mtl.how/data to look at the facility data. |
We will build our team in the MTL Data User Interface and review our team data. |
![]()
Learning Objectives
After this session, you will be able to:
- Describe the decisions your team made in producing your team data table.
- Test whether team historical trends shown in the “viz” tabs reflect your expectations.
- Apply your clinical expertise to identify new information about a team patient in the “data” tabs.
![]() Done by 00:10
Done by 00:10
In-Session Exercise
Let’s get started!
![]() 00:10-00:20
00:10-00:20
Who would like to “drive” today? [Recommend the Team Lead]
1. Open an internet browser window. Go to mtl.how/data. First select your VISN and then select your facility.
This will take you to the VA’s corporate data warehouse site, the Business Intelligence Service Line (or BISL), where you will log in with your VA email and PIV passcode. This site contains Protected Health Information (PHI), so as a provider you will be granted access according to the permissions that are set up on your PIV.
We’ll show you how files you pull from here will be saved back to the secure site, so that you can protect patient PHI just as you do in all your work.
On the landing page, select your VISN ______________. On the next page, select your team’s facility ______________.
2. Explore the facility data.
To view facility data click on the […] next to the file “facility.xlsb” and click “Edit” to open in Excel.
Team files are in team folders. If you do not see a team folder, click on "Request New Team Folder in the horizontal header next the BISL logo.
The facility data is designed to show trends relevant to your team vision of __________________________ for the last two years. Let’s explore the information available in the facility data Excel spreadsheet.
There are two types of View options at the bottom of the spreadsheet. __________________ [Team Lead’s name] Will you please click through them, so we can see what each displays?
| View | Displays |
|---|---|
| Count (in Viz tabs) | Count tables that match the viz graphs |
| Data | Sortable report of de-identified individual patient data |
| Viz | Visualization of trends over time. |
There are four main data sets in the facility data:
[During intersession prep, facilitator should fill-in the rankings of the highest priority data categories that should be emphasized. Follow the team’s lead “live” during the meeting, but be prepared.]
| Rank | Data | Displays |
|---|---|---|
| ___ | Diag | Primary diagnosis only on visits in that setting level. (Note: In DataDiag, unique visits are shown, since each visit can only have one primary diagnosis. For more detail, open up the data UI.) |
| ___ | Enc | Encounter or visits types, such as medication management, psychotherapy, intakes etc. |
| ___ | HF | Health Factors data related to visits, including evidence-based psychotherapy templates, and other clinical reminders and screenings. |
| ___ | Meas | Standardized symptom scales, such as the PHQ-9 for depression or PCL-5 for PTSD, and suicide and behavioral risk flags. |
To sum up, there are three ways to view each set of data:
- Counts per month: countDiag, countEnc, countHF, and countMeas;
- Visual charts of trends over time: vizDiag, vizEnc, vizHF, and vizMeas
- Drill down patient-level data: dataDiag, dataHF, and dataMeas.
![]() 00:20-00:25
00:20-00:25
All data is sortable and filterable so that the team can transparently see how the charting you do all day becomes VA data.
- Last meeting [team members’ names] mentioned concerns with [themes from Part 1].
| Time Stamp | Team Learning Priorities | Script for Part 1 |
|---|---|---|
| What filtering options are available? | Themes from the team vision to be highlighted. | Team Data to Prioritize with the Team. |
For each “viz” chart, you can filter on location and clinic name (upper left) to zoom in to the clinic or VISTA clinic/“grid”. [During intersession prep facilitator should fill-in the rankings of the highest priority viz that should be emphasized during the team meeting. Follow the team’s lead “live” during the meeting, but be prepared.]
Rank viz Options ___ vizDiag See trends in what types of diagnoses the facility/team is spending their time on (data are based on the primary diagnosis of each encounter, not the problem list for each patient.)* ___ vizEnc See trends in what services the facility/team is spending their time providing.* ___ vizHF See trends in what specifics the facility/team’s patients are getting in their encounters (in vis, this is a very long list.) ___ vizMeas See trends in what standard measures the facility is using on their patients. Are they screening more for alcohol use disorder or depression or PTSD?* ___ dataDiag can be sorted by primary diagnosis type based on ICD-10 code to see more detail on what happens in any one diagnosis type* ___ dataHF can be sorted by health factor type to see more detail on what happens in any one health factor type.* ___ dataMeas can be sorted by measurement type to see more detail on what happens in any one measurement type.*
If the data is not loading or showing incorrect facilities/clinics, here’s how to refresh.
- To refresh your facility file’s data, right click on any tab at the bottom of the Excel spreadsheet and select “Unhide…”.
- In the “Unhide sheet:” dropdown, select “Control” and click “OK”.
- In the “Control” tab, select your VA facility’s station number in the “Station:” dropdown and click “Refresh”.
- Do not worry if you see your Excel worksheet become unresponsive as the data is refreshing and will take about 1-2 minutes to complete.
- As a warning, Do NOT click on “Propagate” as this is used by our data team to update facility data across the nation.
To create a fresh data UI file, go through Steps #3-5. We will show you the steps but you already have a fresh data UI file.
3. Scroll to your team folder at the bottom of the page. Open the data_ui folder and open your data_ui file in Excel.
If you do not have a data_ui file or need a newly updated one, copy the file in the Master_DataUI folder. This has a master data_UI file that has already been pre-selected for your facility/station.
Click on the 3 dots […] next to the data_ui file.
Click on “Edit” to open in Excel, then click “Edit Workbook” at the top of the sheet.
4. Go to the ClinicSelection tab. Use columns C-H to select the clinics that make up your team.
This data_ui file has already been specified for your facility/station.
You can sort by Clinic Name, Division Name, Physical Location, Primary Stopcode, Secondary Stopcode, and Default Provider.
Note that this will pull all clinics used in the last two years, including de-activated clinics (denoted by a “ZZ” prefix). You can also see the de-activated clinic’s inactivation date in column I.
Follow the instructions in Box A2.
After filtering, you can double-click on clinics to add them to column A, or you can highlight the clinics and click the gray “add all” button (Cell B6) to add them to column A.
In the future, if you want to quickly get the same list of clinics again, you can select the grey “Get previous clinic list from last click of Get Patient-level Data” arrow in Column B (Cell B3).
5. To view your team patient data and your team trends click “Get Patient-level Data.” We will not do this in-session today.
You already have a fresh data UI file to work with in your data_ui folder. With your team lead (________), we selected the following clinics to represent your team.
To query patient and clinic level data using the data_ui, you will need LSV permissions. To check which facilities you have LSV access for, click the link to access the document through VA intranet.
If you don’t have access to facilities that you believe you should, please verify:
- CPRS access/permissions at your station (i.e COR tab access for CPRS).
- Your network username recorded in VistA. To have your network username recording in VistA, please follow the instructions outlined in the linked document through VA intranet.
It takes some time to stitch together a “hyper-local” query tailored to your team from the VA Corporate Data Warehouse.
On average (depending on the size of your team) it may take 15 minutes or so for your team data UI to pull in fresh data. And, Microsoft Excel will be unresponsive until the data UI has finished pulling in your data.
**Prior to today’s session, __________________ [Team Lead’s name] worked with us to build an initial team dataset.
__________________ [Team Lead’s name], which column did we find most helpful for creating this team’s dataset?
Are there any adjustments that the team would make to the clinic selection criteria? For example, should we include trainees? Other considerations that seem important?
We will look at the “Create Team Data Table” button and its associated tab “SPReferrals” next time.
6. Click to view the “viz” tabs, which show team trends.
Just like the facility data, there are team trends for diagnoses, encounters, health factor data (e.g., suicide plans, evidence-based practice templates), and measures from mental health assistant. Your team’s vision was about [ __]. Let’s go to the [__ ] viz tab to see data relevant to that issue.
You can further drill up/down in the “viz” tabs by right clicking on any trend line and clicking on “Quick Explore" (look for the magnifying glass). In the ”Explore“** box, pick the item you want to explore and click on "Drill To”. Keep using Quick Explore to drill until you reach the data you want. You can always click on the gray “Reset Pivot Chart”** button to return to the original settings.
The viz tabs will also always return to default selections every time the team clicks on “Get Patient-level Data” to refresh data in their data_ui file.
Note: If you use the “Quick Explore” drill down using patient names, all of the asterisked patients will be grouped together.
You can also right click on the line in a trend visualization and filter to hide a selected item or keep only the selected item.
vizDiag in the data UI shows a drill down by diagnoses or combination of diagnoses. For example, the “PTSD” line is for patients with only PTSD. The “PTSD & AUD” line is for patients with both these diagnoses but does not discriminate between which is the primary, secondary, etc. diagnoses.
dataDiag in the data UI has an additional column after “Diagnoses of Interest,” called “Primary Diagnoses”. “Diagnoses of Interest” retains all the current unordered diagnoses combinations, while “Primary Diagnoses” indicates what is the primary diagnosis. This means that if there is only one diagnosis in the “Diagnoses of Interest” column, it will still repeat what that diagnosis is in the “Primary Diagnoses” column.
To filter by Veterans Video Connect, known as VVC, use the grey VVC filter button in the top left hand corner of the visualization in the vizEnc tab.
 00:25-00:35
What stands out to you about ________________________________[fill-in team vision]**?
What is most important to you to check out first related to ________________________________[fill-in team vision]?
[Prepare in advance, but ask this as an open-ended question]?
What is most surprising?
[Prepare in advance, but ask this as an open-ended question]?
00:35-00:40
7. Click to view the “data” tabs, which show your team’s individual patient information.
Patients who have requested restricted access to their information have asterisks (****) in Column F (dataDiag, dataHF) or Column E (dataMeas). If you are a VA provider, you can still identify patients from Column G (dataDiag, dataHF) or Column F (dataMeas).
Patient information corresponds to the same categories as the team trends: diagnoses, encounters, health factor data (e.g., suicide plans, evidence-based practice templates), and measures from mental health assistant.
Providers can filter to find specific patients, or produce reports.
00:40-00:50[During intersession prep facilitator should fill-in the rankings of the highest priority viz that should be emphasized during the team meeting. Follow the team’s lead “live” during the meeting, but be prepared.]
Time Stamp Team Learning Priorities Script Prioritize which questions you will use given this team’s guiding vision. Keep an eye on timeThemes from the team vision to be highlighted. Team Data related questions to Prioritize with the Team. What data tab would you use to find out how many current patients on the team are engaged in a specific evidence-based psychotherapy? What column shows you the session number (EBP template) that the patient is on.
What viz tab would you use to see what the most common service encounters or visits are?
Are there services that have been increasing over time?
Are there services that have been decreasing over time?
With the team trends (viz) and team patient (data) information in the data UI, your team can efficiently use team meetings to focus on the interrelated issues of care coordination and team quality improvement.
That’s it for Modeling to Learn how to check our patient data and team trends. Next is our Done/Do review.
Done and Do (15 minutes)
| We selected the clinics that make up our team for the Team Data UI. |
Review the HF, Diag, Enc and SP tabs in Team Data to find a patient (zoom in) and find a team trend (zoom out). Log in to mtl.how/data and look at the two team folders: data_ui and team_data_table. |
DO demo
- We encourage you to look around in your team data before next time.
- Go to mtl.how/data and open the team data in Excel.
While waiting for the excel to open, let’s review the three reasons to use the excel-based Data UI over the facility data Excel spreadsheet:- You can select a set of clinics (grids) that exactly represent your individual team.
- All the patient-level data are identified with patient names.
- You can create parameters that represent averages or medians for the team over the past two years.
- Review your individual patient data and identify team trends:
- Health Factors (HF)
- Diagnoses (Diag)
- Encounters (Enc), and
- Measurement Based Stepped Care and Suicide Prevention (SP)
Until next time, thank you for Modeling to Learn!

4.2.2 Part 02 Say Guide
Hello! I’m _______ and I’m _______.
Today we’re modeling to learn how to calculate team parameters.
Done and Do (15 minutes)
| We reviewed the HF, Diag, Enc and SP tabs in Team Data to find a patient and a team trend. We logged in to mtl.how/data and looked at the two team folders: data_ui and team_data_table. |
We will examine calculated team parameters for CC, MM, PSY, AGG, and SP. |
![]()
Learning Objectives
After this session, you will be able to:
Describe your team trends over the last two years based on the estimates in the team data table.
Test your understanding of how the team data are estimated by reviewing descriptions and definitions.
Apply your clinical expertise to consider the team trends in the data UI and team data table to identify team priorities for learning.
In-session Exercise (30 minutes)
Let’s get started!
Who would like to “drive” today? [Recommend the Team Lead]
Navigate to the data UI at mtl.how/data
- You’ll log in with your VA credentials and you should have all the same permissions here as you do in general for your role in the VA.
- Scroll down to your team folder. You should have two folders: data_ui and team_data_table. Click on the “data_ui” folder and open the Excel file.
Clicking the “Create Team Data Table” button produces a table of descriptive team data.
You already have a fresh Team Data Table file to work with in the team_data_table folder.
It takes some time to generate a team data table for all modules using your team’s data.
On average (depending on the size of your team) it may take 15 minutes or so to generate a team data table. And, Microsoft Excel will be unresponsive until it is finished.
This is a different table from the one you generated last time by selecting the clinics that make up your team and then clicking “Get Patient Level Data.”
Data in this file are means, medians and percentages of key variables likely to influence the team’s priorities for learning from Modeling to Learn.
There are team data produced for each module of Modeling to Learn, each stored in its own tab:
- Care Coordination (CC) - tab title CCParams
- Medication Management (MM) - tab title MMParams
- Psychotherapy (PSY) - tab title PSYParams
- Aggregate mix of services (AGG) - tab title AggParams
- Measurement Based Stepped Care and Suicide Prevention (SP) - tab title SPParams
The patient cohort for each module is built by capturing all the unique patients who had a visit with the given team (from the user-supplied list of clinics/grids) within the correct encounter bin between 18 and 6 months ago. From that set of clinics, patients, and CPT codes, the data query then fetches all visits, no matter how long ago or how recent.
In order to capture parameters that should be time-bound, such as new patients per week, the query can use that single year (e.g. from the patient cohort, how many were new to the team in the year that was used to build the cohort? Because that patient count captures all new patients over the year, we can just divide by 52 to get an average new patients per week).
For parameters that should not be time-bound, all the visits can be considered, so that some patients will correctly be fed into the model with many visits over years of engagement.
We have already produced a team data table for you, but to do it yourself:
- Select a set of clinics in ClinicSelection tab similar to what you did last session. In the future, you can pull up the same clinics used last time for creating the team data table by clicking on the gray “Get previous clinic list from Create Team Data Table file” button (Cell B4) to add them column A.
- Additionally, if you want to produce team data for the SP module, click on the SPReferrals tab. Use this tab to select clinics that your team refers to/receives referrals from for the Suicide Prevention module. The data pull will track patients stepped up/down between your team and the one(s) you select. For example, if you are a GMH team, you would select “SMH” in the dropdown for “The clinics selected below that my team refers to are” and add the SMH clinics your team refers to in Column A. Once you have selected referral clinics in the SPReferrals tab, return to the “ClinicSelection” tab.
- Click on the module drop-down. You can choose any module individually (CC, MM, PSY, AGG, SP), all modules without SP, or all modules including SP. If you are choosing “SP” or “all with SP”, make sure to do the previous steps using the SPReferrals tab.
- Click on “Create Team Data Table”.
- If you included SP in the module selection, three pop-ups will appear for the three possible care settings (GMH, SMH, PC/PCMHI) to indicate the threshold for minimum gap in patient care required for subsequent visit to be considered a new care episode. In general for the (GMH or SMH or PC/PCMHI) setting, how long of a gap in patient care is required for the subsequent visit to be considered a new care episode? Set the threshold below in weeks. The default threshold is 39 weeks (9 months).
- The team_data_table file you generate will automatically be saved into the team_data_table folder. Regardless of the module selection you make, the team_data_table file will include all five module tabs and labels, but will populate zeroes (“0”) for all parameters of modules that were not selected.
Navigate back to your team folder at mtl.how/data. Click on the “team_data_table” folder and open the Excel file to find the team data table already produced for you.
1. Select a module for review
- To show what data are used to tailor each MTL module to your team.
[Choose a module]
CCParams: Key variables of interest in CC may include median engagement in weeks, appointment supply in appointments per week, return visit interval in weeks, starting rate in patients per week, and new patient wait times.
MMParams: Key variables of interest in MM may include median engagement in weeks, appointment supply in appointments per week, return visit interval in weeks, starting rate in patients per week, and slots allocation percent for providers with and without an X waiver.
PSYParams: Key variables that can be explored in PSY include median engagement duration and engagement after the patient’s first 3 months measured in weeks, appointment supply by service type (AUD, DEP, OUD, PTSD) within 3 months, and return visit interval after 3 months in weeks.
AggParams: Key variables in AGG include median engagement in weeks, appointment supply by service type, return visit interval in weeks, new patient start rate (mean), and service proportions from team data.
SPParams: In SP, key variables of interest may include high risk flag rates, engagement times before ending treatment in a specific setting, engagement time before stepping down or up between care settings, wait times, and the ratio of high to low symptom patients in each setting.
Check out the different modules that are highlighted in the team data on the screen. As we review, we will use the mouse to highlight key team data variables.
Find a variable that is important to your team. Look at how the variable is estimated in the table. Notice the units.
Where can you find even more detailed information about your team data? In each of these Params tabs, you can find more detailed information about your team data.
Check out the two columns to the right of the numerical data [show with mouse]. Let’s explore these two columns. This column [highlight column] gives the description or definition of the variable. This column [highlight column] contains additional details about how individual patient data are extracted and used to calculate your team’s historical trends.
2. Select a second module for review
Check out the last 2 columns, to the right of the numerical data. This column [highlight column] gives the description or definition of the variable. This column [highlight column] contains additional details about how individual patient data are extracted and used to calculate your team’s historical trends.
Find a variable that is important to your team. How is it estimated in this table? What are its units?
Where can you find even more detailed information about your team data?
You can click on the “DataNotes” tab for a breakdown of how the patient cohort is defined, which CPT codes are used to define each service, and the patient engagement patterns (for the Psychotherapy module).
3. Are there any team data table values you would like to explore in the team data UI?
- If so, which ones? Open the data UI to examine your question.
4. Does the team see any values in the team data that seem to vary significantly from expectations?
If so, what is it surprising?
Does the estimation definition (second to last column, text in red) help you to interpret the variable value?
5. Does the team see any values in the team data that fit your expectations about high priority team needs?
If so, what are you noticing?
In what ways does the team data fit with your day-to-day clinical practice in your team?
That’s it for Modeling to learn how to calculate team parameters. Next is our Done/Do review
Done and Do (15 minutes)
| We examined team parameters for CC, MM, PSY, AGG, and SP. |
Find something in the team data table and consider its implications for team decisions. |
DO demo
- We encourage you to look around in the team data table before next time. Test whether you can find a piece of data you decide to look for. Just take a minute, if you can, to become familiar with the format and content of the data table.
- Remember, you can click through the Params tabs, one for each module, to dig into the details of how each parameter is calculated in the text columns to the right of the numerical data.
Until next time, thank you for Modeling to Learn!